If you are a technical trader, apart from price, volume is one of the main ways to discover insights into the trend of a token. Therefore volume-based indicators are a key tool for any trader.
They are real-time and help to show what is happening in the underlying demand and supply dynamics of a token and will help to identify a change in trend before the price fully reflects it.
There are many volume-based indicators in the market, let's explore one that is popularly used by crypto traders, the Cumulative Volume Delta (CVD).
What is the Cumulative Volume Delta (CVD) indicator?
The indicator can be found on Coinalyze charts under the "Indicators” button and by searching "CVD" and clicking on 'Cumulative Volume Data'.
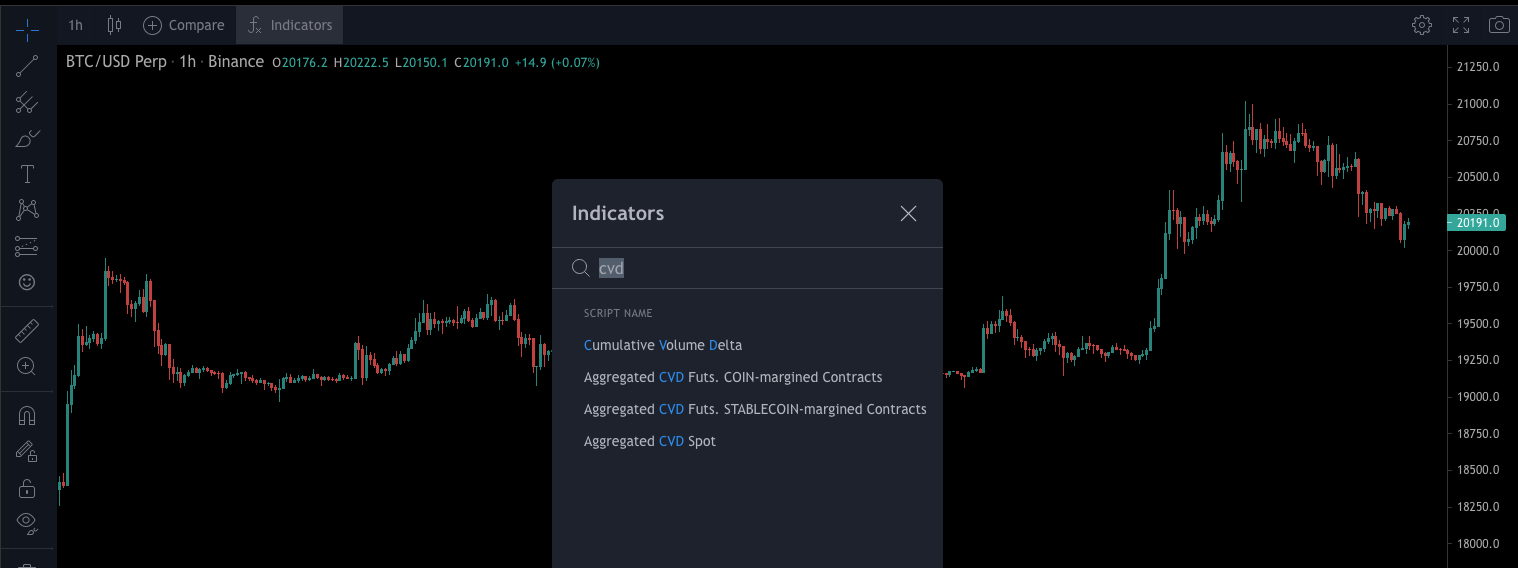
What's interesting is that it is a proprietary indicator developed by them and is not available even at TradingView (side note it would be nice if they made a premium script so we can still stick to TradingView for all our charting).
Once you click on it, the indicator will appear as below:
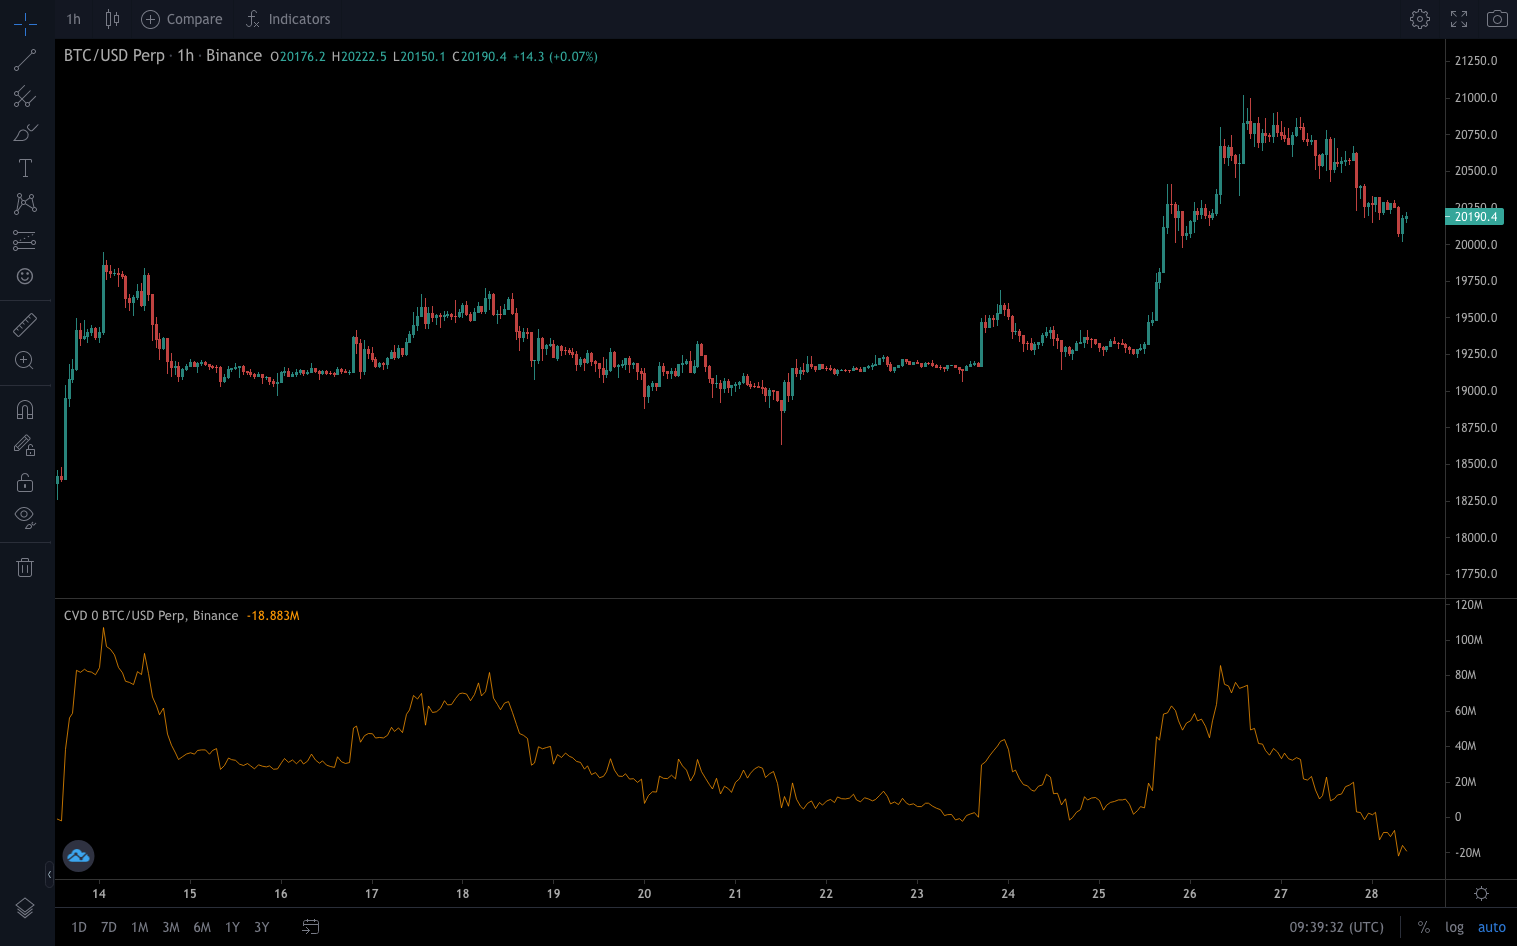
There are some additional inputs that may be important such as "Buy Volume", "Sell Volume" and "Delta" but we will keep things simple for now and just go through the CVD indicator.
Let's explain how this indicator works.
The Cumulative Volume Delta (CVD) indicator accumulates the delta. Delta is the difference between buy and sell volumes within a given time interval.
If the CVD line is pointing down, that means there are more selling pressure. This is usually a sell signal and a trader should search for shorting opportunities. If the CVD line is pointing up, it means that there is more buying pressure for the asset.
How the Cumulative Volume Delta (CVD) indicator help traders
CVD is a another look at the summary of the buying and selling activity of the market beyond simply what the price is telling you. Market manipulators can easily manipulate the price up or down, but the CVD can signal certain contradiction to what the market is actually doing to determine how the price moves eventually.
This indicator is better suited for shorter time-frames and is great way to get an edge especially for day traders. However it is not accurate over higher time frames and is not reliable as a long-term investing strategy.
For the best result, we recommend that CVD be activated in 5-30 minutes chart.
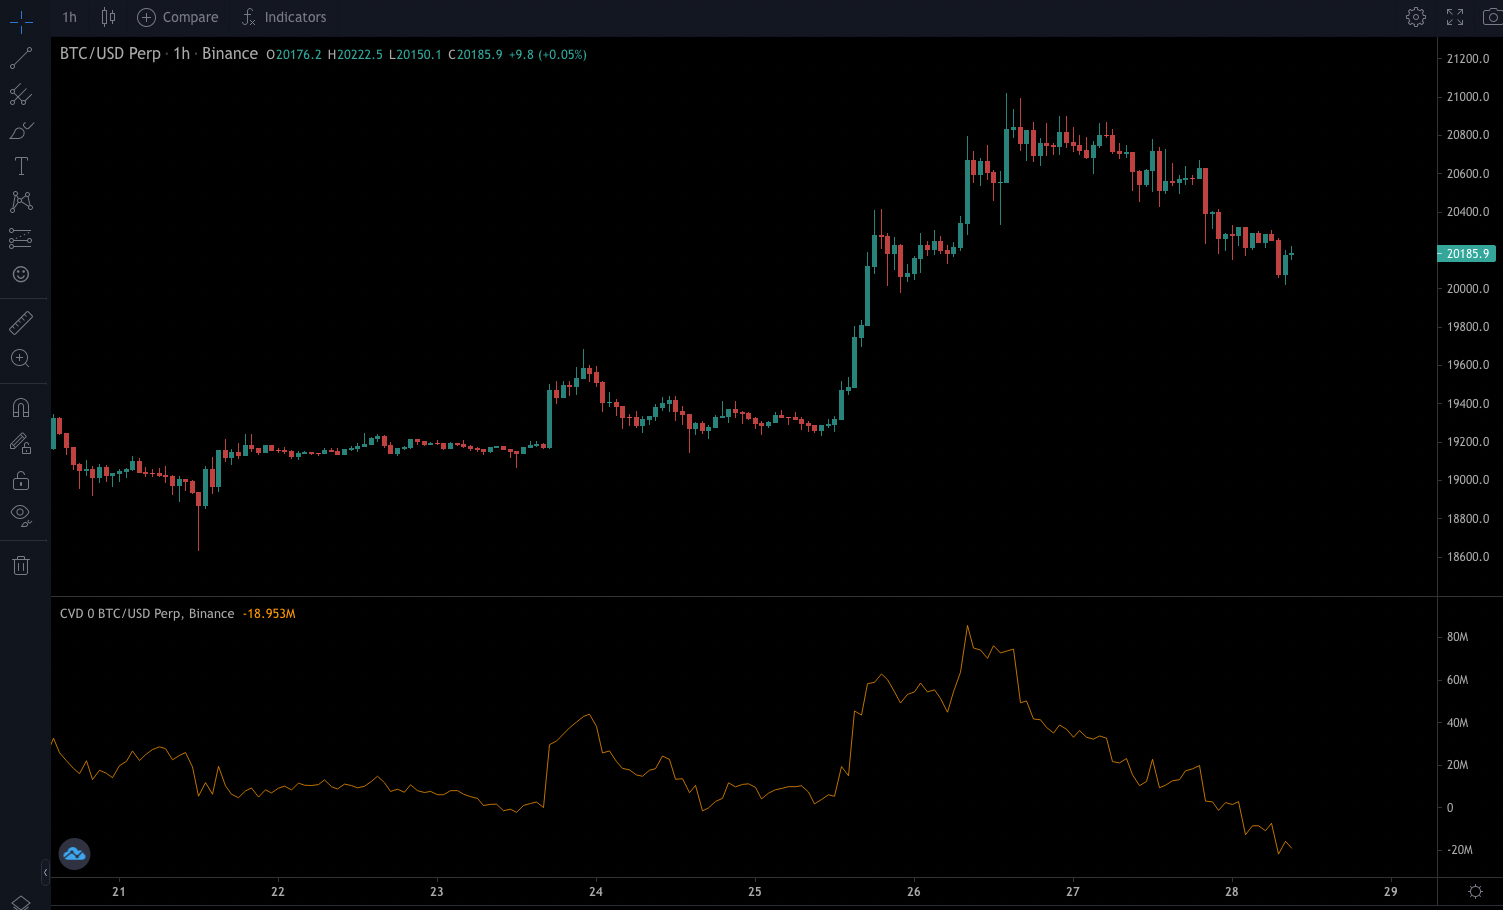
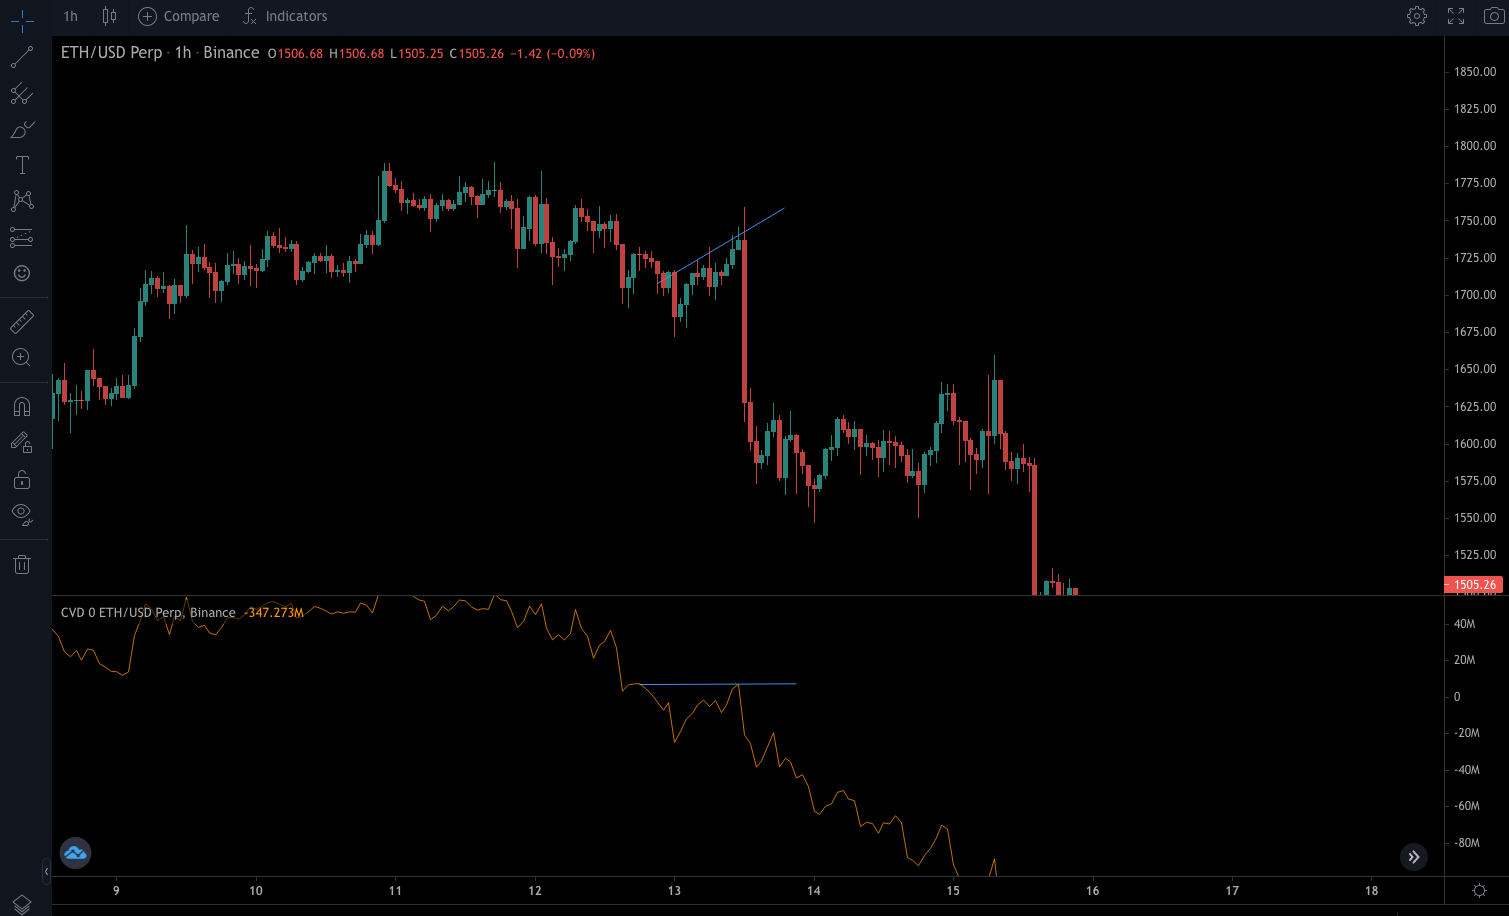
Here's an example where the CVD started to point down although BTC price was still pointing up. This meant that sellers were stronger than buyers and the price eventually retraced.
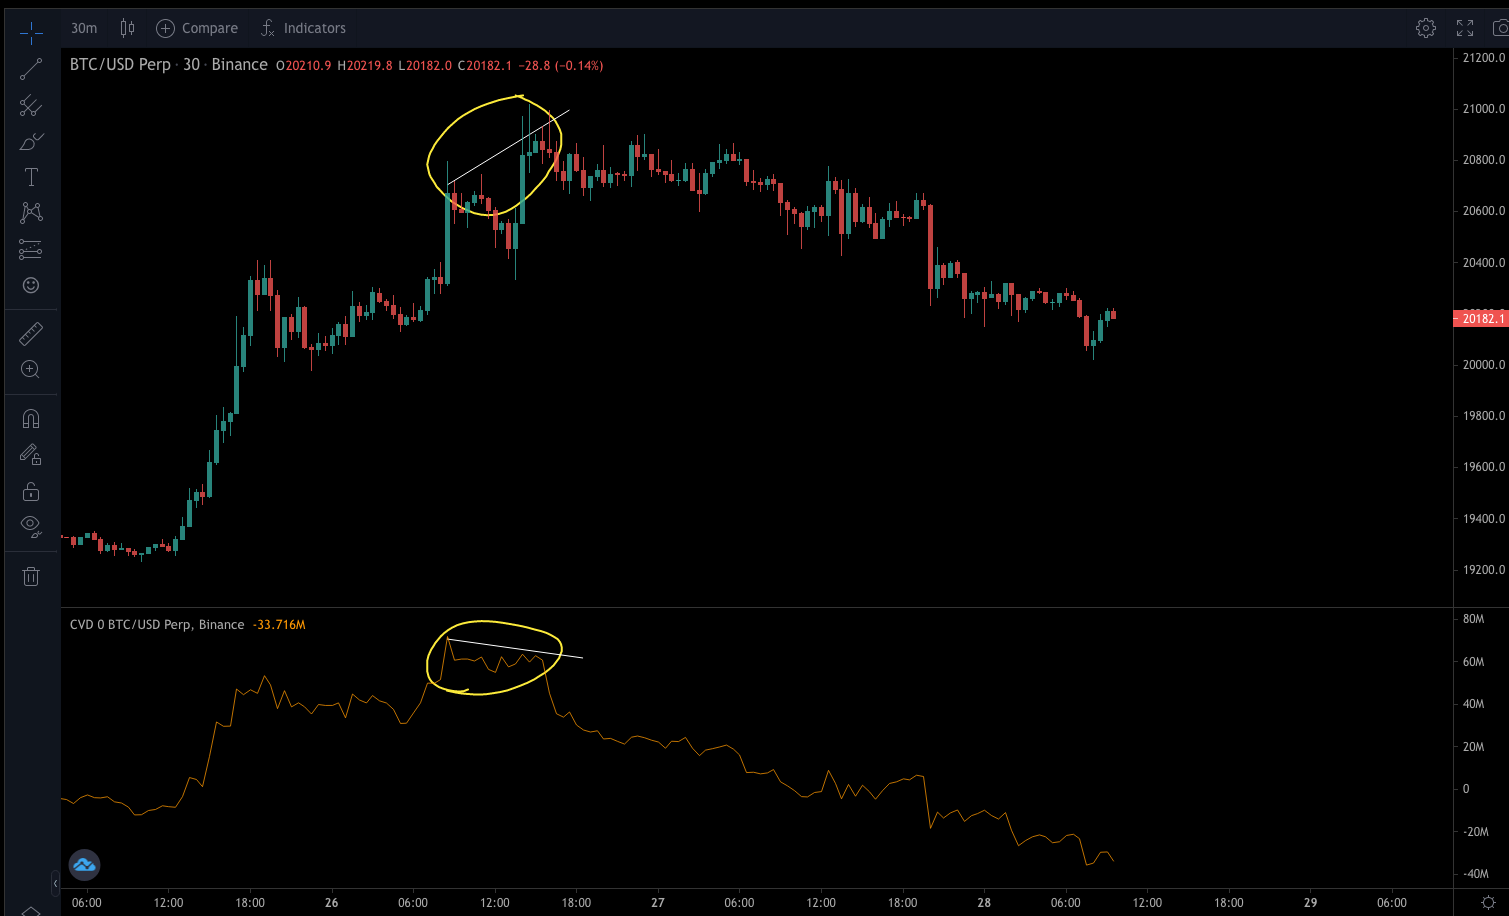
Additionally, if the CVD remains sideways but the price has made a move, it may be a fake move and the price might move in the opposite direction next.
But nothing is guaranteed, so proper risk management and stop losses are always necessary, which you can perform on Demex, a derivative dex!
Combining with Other Indicators
There is no one size fits all strategy and the best approach is often to combine indicators to make a more informed decision with conviction. For example, you can use the CVD indicator with the Stochastic RSI indicator, one of my favourite indicators that I talk about in this crypto trading strategy article!
In a rising market, the CVD will be pointing up as there are more buying pressure. In a downwards market, the CVD will be pointing down as sellers are in charge.
When the CVD is flat, the market could be in accumulation (bullish) or distribution (bearish), and neither buyers nor sellers are in control. It is best to stay out of a trade when the market is not clear, until either the CVD trends in a direction.
Conclusion
CVD may offer day traders a unique edge by giving clearer insights on net buying and selling activities and is not available on the popular TradingView platform that many traders use.