
The price of assets, such as crypto and stocks, are not just determined by fundamentals in today's financialized world. The liquidity of the financial markets play an increasingly big role in how the price of assets are derived.
In today's article, we will explore how you can use the strength of the dollar, also known as the dollar index, the liquidity of the dollar, as well as the price of the dollar, aka the interest rate, to potentially determine market bias, and give yourself an edge in trading crypto.
What is the Dollar Index (DXY)?
Starting with the U.S. Dollar Index (DXY), also known as the 'Dixie', it is the symbol for the US dollar index, which tracks the price of the US dollar against six foreign currencies, aiming to give an indication of the value of USD in global markets. The index rises when USD gains strength against the other currencies and falls when the dollar weakens.
The US dollar index is a live measure of the performance of the US dollar against a basket of other currencies. It’s a popular way to track the value of the world’s most-traded currency and a key market in its own right.
How to use the DXY to trade crypto better
As the US Dollar is the world's reserve currency and most assets, especially crypto, is denominated against the USD, there are periods where there are certain inverse correlation between the DXY and the crypto markets.
This is because most crypto's utility has not gained traction or user adoption, and the price is largely speculative in nature, thus the price is reflexive towards the value of the unit that it is denominated in, which is USD and is measured partially using DXY.
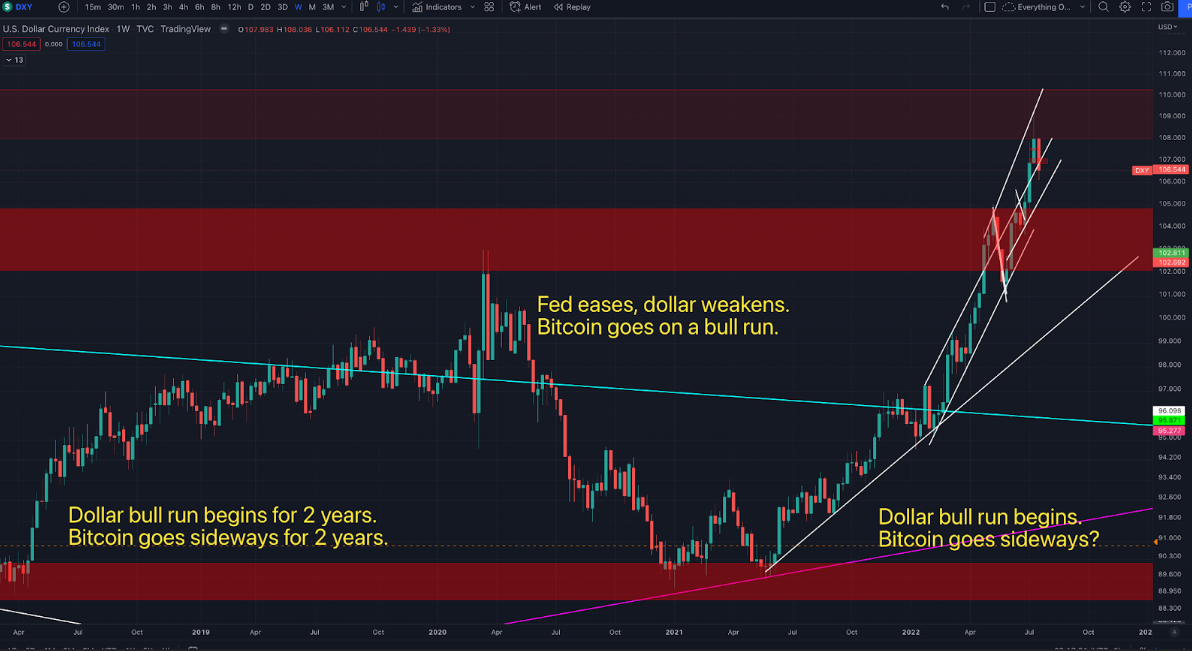
For example, when DXY is bullish, crypto is usually not bullish, and when DXY is bearish, crypto tends to be bullish.
With the dollar index currently on a bull run, breaking local highs by going above 109, a level not seen since 5 years ago, we've seen crypto struggling and largely moving sideways or down.
Thus a trader can also factor in where he thinks DXY will go based on macroeconomic events, to determine how he will trade crypto.
What moves the price of the US dollar index?
The price of the DXY is moved by macroeconomic events, data such as GDP, the economic health of each country, and the monetary and fiscal policies of each central bank.
Another large influence on the US Dollar index’s price is safe haven inflows. The index can rise during periods of uncertainty if traders regard the US dollar as a value store amid global economic crises. The index can fall if risk-on sentiment dominates, i.e. due to quantitative easing and low-interest rates, prompting investors to sell off USD and move into riskier assets to capture more yield.
One more possible reason could be the carry trade ending, where investors long risk-assets and short volatility while being financed with cheap USD. Due to increased interest rate on USD, investors are need to pay back more and more of their USD debt, and this is done by selling risk-assets, resulting in USD going up in value and risk assets going down in price.
In summary, if a trader remains bullish on the dollar, for reasons such as quantitative tightening, then the trader may prefer to short crypto rallies rather than long crypto crashes as the bias is sideways or down.
On the other hand, if a trader thinks that the dollar's bull run is coming to an end, for reasons such as inflation is coming down and the Fed might ease monetary policies, a trader may prefer to start looking for opportunities to accumulate or long crypto when there are dips as the bias is sideways or up.
How to calculate the dollar index
You can find the dollar index easily on TradingView but knowing the weightings of the basket is important if you have an understanding of forex and geopolitical matters.
Today, the weightings used to calculate the dollar index are:
- EUR/USD - 57.6%
- USD/JPY - 13.6%
- GBP/USD - 11.9%
- USD/CAD - 9.1%
- USD/SEK - 4.2%
- USD/CHF - 3.6%
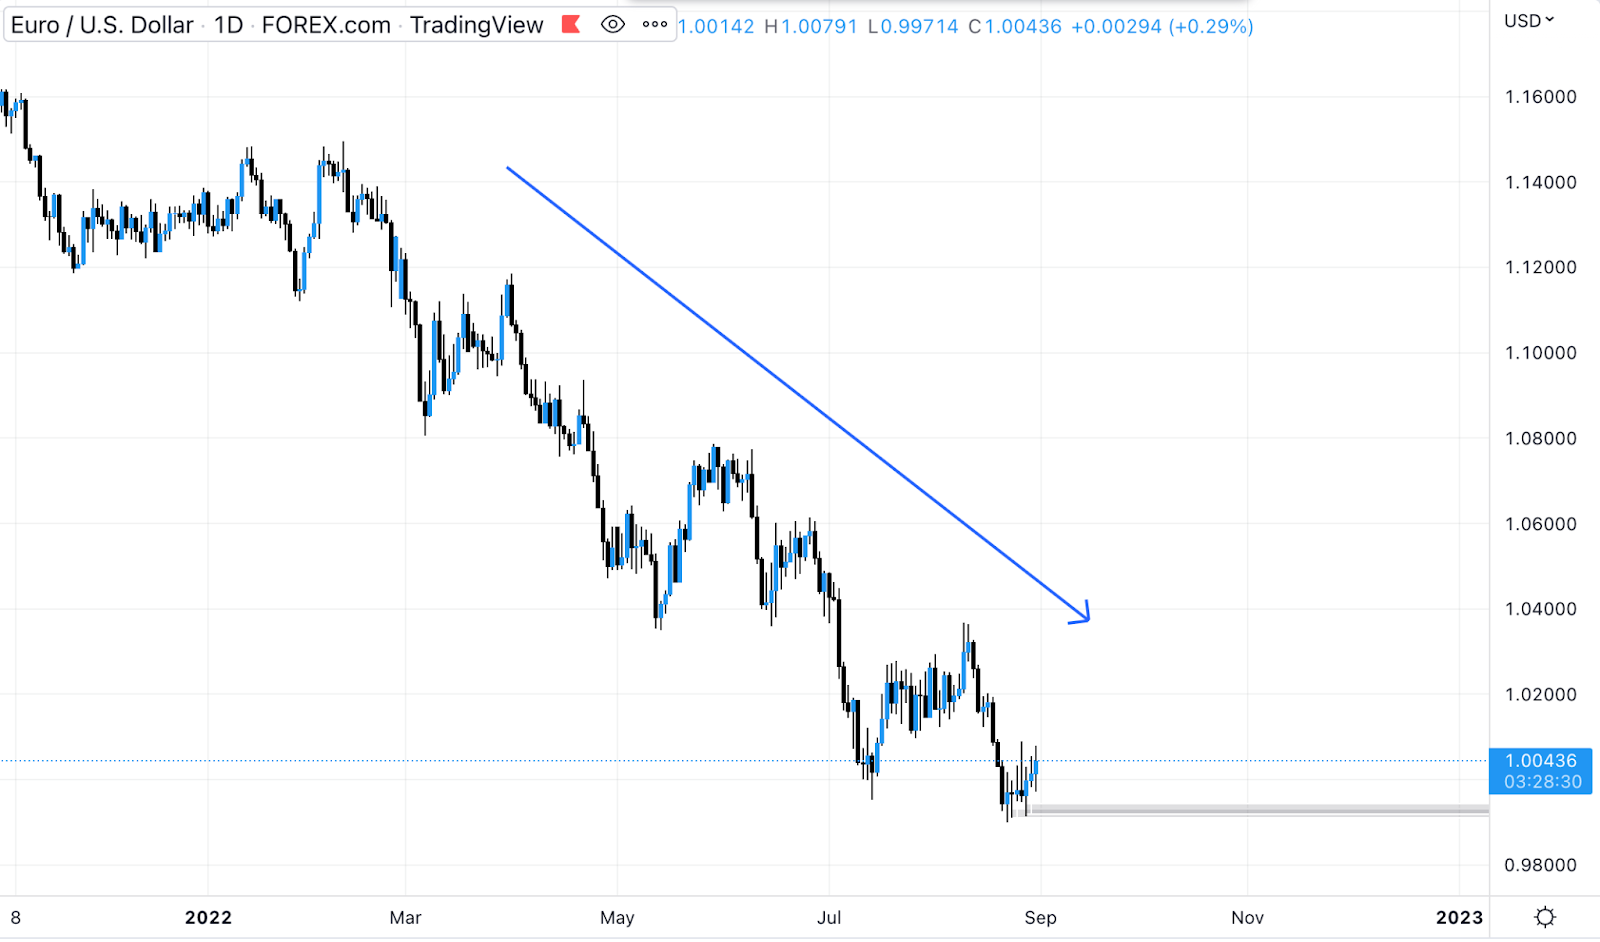
As you can see, the DXY is largely driven by EUR, which has taken a huge beating at the moment due to the inflation they are facing now.
US dollar index highs and lows
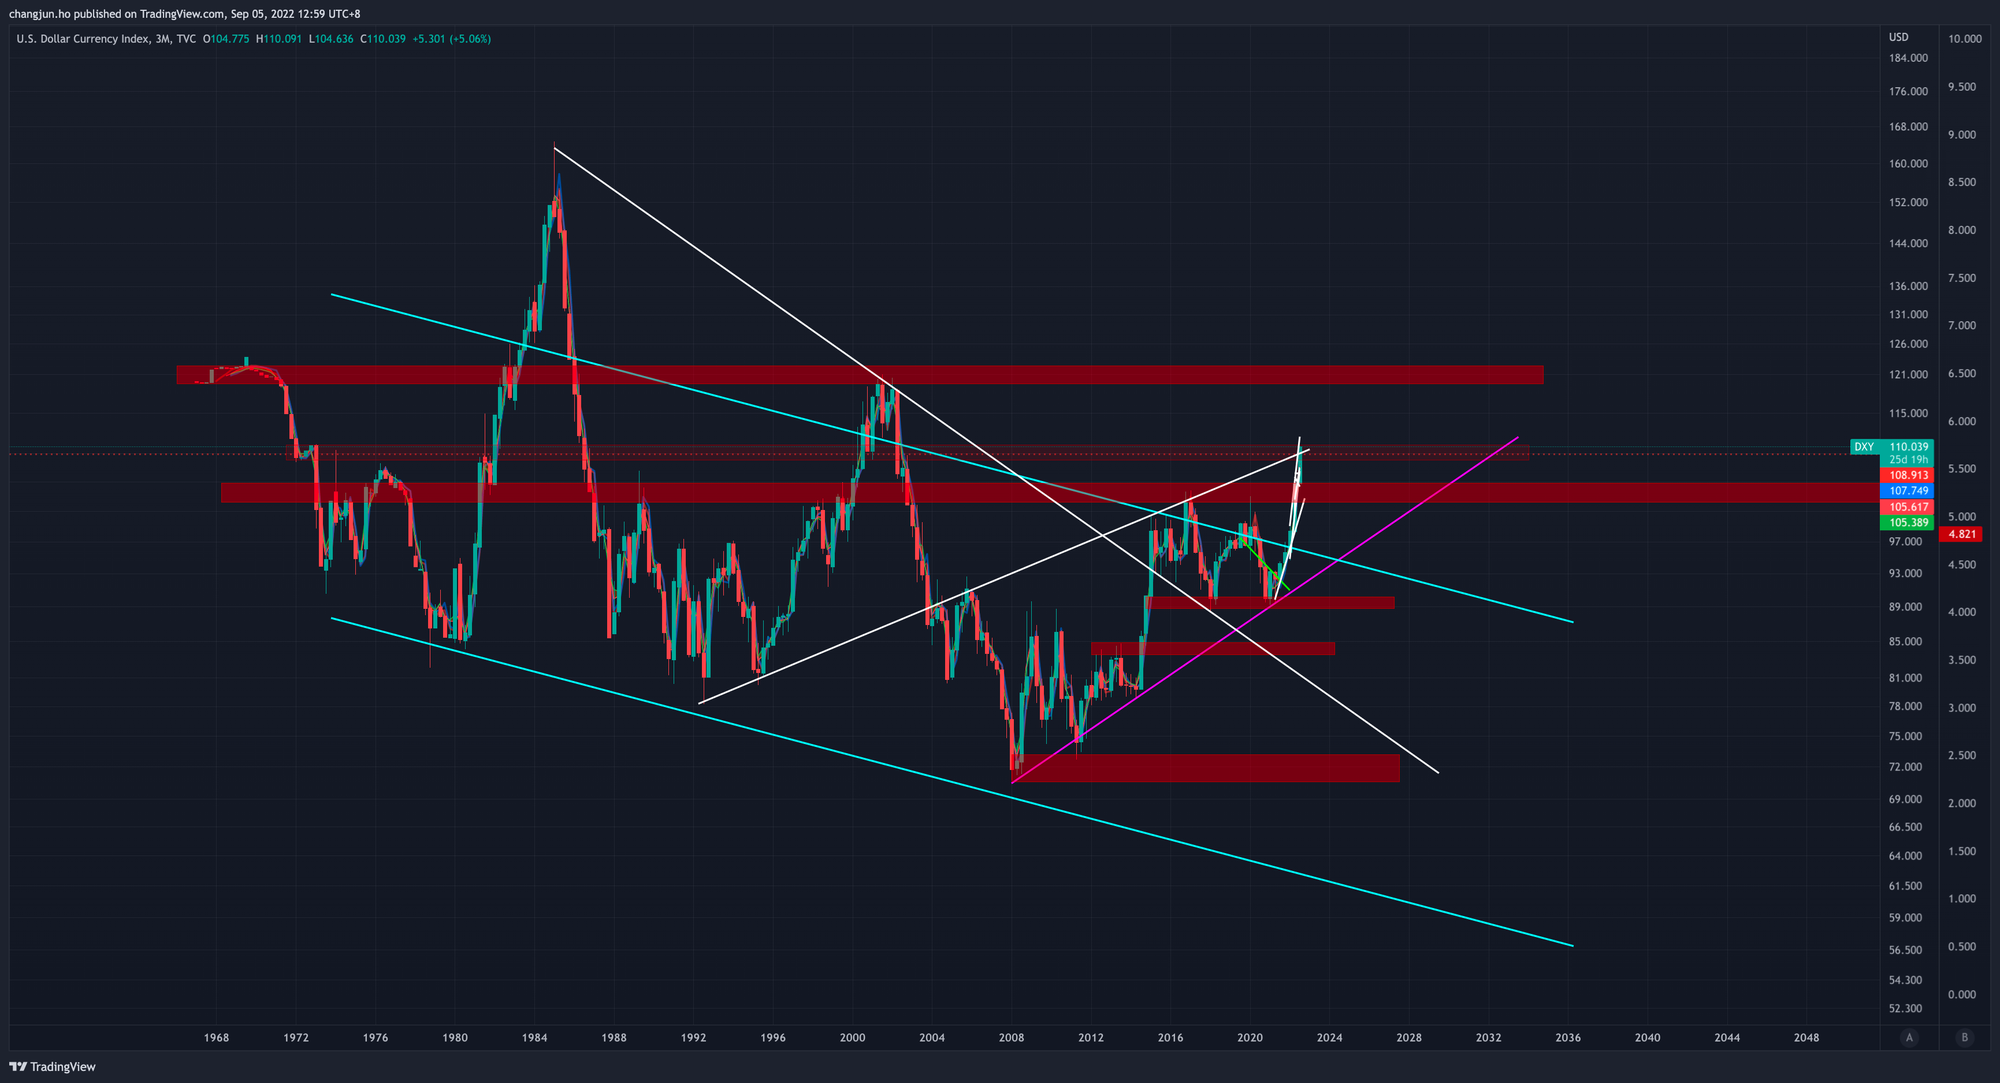
The DXY has traded in a wide range during its history, and unlike other indices it hasn’t risen overall since its inception. In fact, it reached its record high back on 5 March 1985, when it peaked at 163.83.
The record low is much more recent, landing on April 22 2008 at the outset of the great financial crash. As the index began at 100, the DXY is now at 110 and is stronger now than it was in 1974.
US Dollar Liquidity
The next key US dollar metric we will look at is dollar liquidity, aka the quantity of USD that is in the financial system.
Arthur Hayes wrote an in-depth explanation of this, and you can read it here.
Typically, the higher the dollar liquidity, the more likely it is for some of those dollars to find their way into the stock market, hence the positive correlation between USD liquidity and the stock market.
A common indicator of the total dollar in circulation is the M2 money supply.
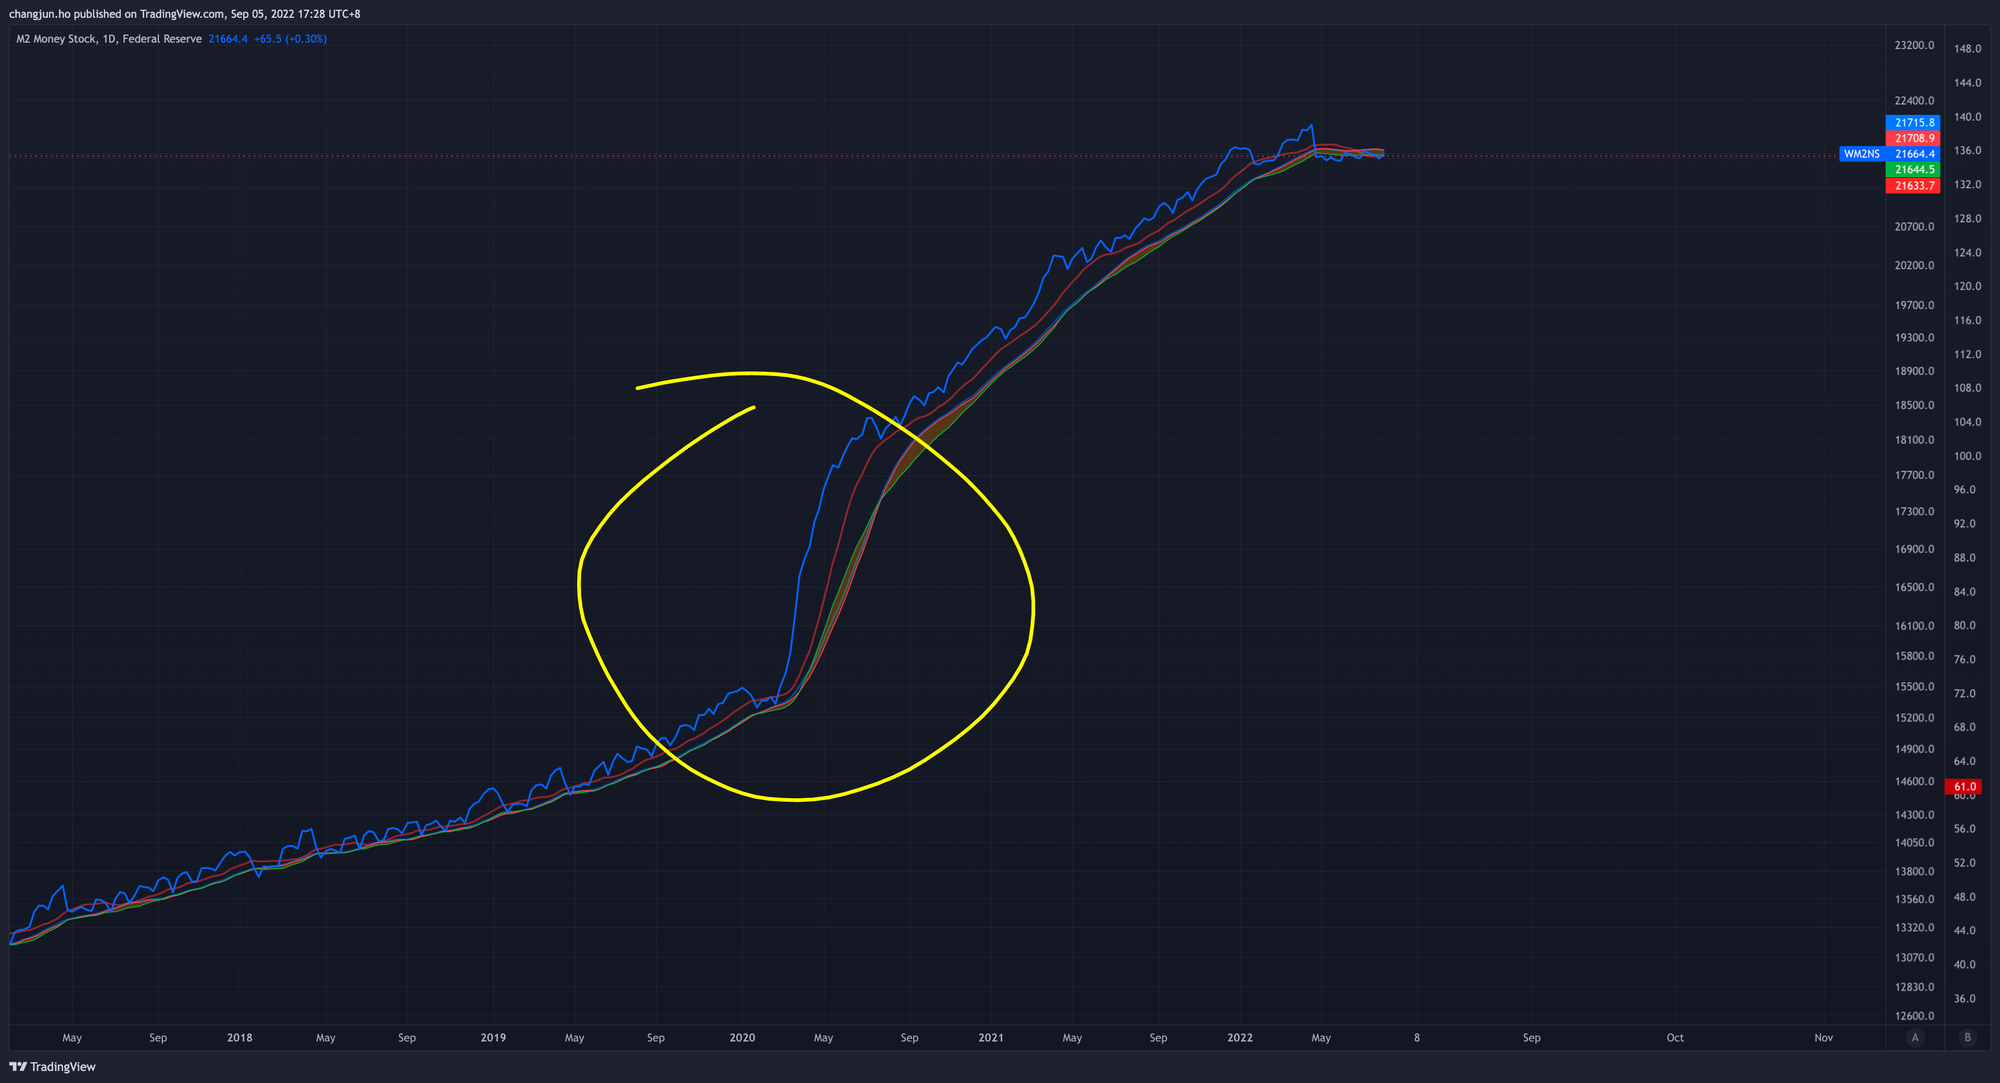
However, the M2 money supply is too broad as it accounts for the measure of the money supply that includes cash, checking deposits, and easily-convertible near money.
What we want to know consists of the Fed's balance sheet, the size of the reverse repo balances at the NY Fed, the US Treasury General Account (TGA) with the NY Fed, as well as when the Fed's US Treasury Bonds are rolling over.
The Fed's balance sheet represents the liquidity in the market, made up of assets like US Treasuries Bonds and Mortgage-Backed Securities (MBS) that the Fed has printed money in exchange for. We need to deduct the assets that the Fed has deployed for reverse repo as those are dead money, as well as deduct the TGA account balance with the Fed as it is the US Treasury's checking account.
Essentially if the Fed balance sheet goes up, they printed more money which adds liquidity. If the reverse repo balance goes down, the Fed is removing dead money back into their balance sheet which adds liquidity, and if the TGA balance goes down, the US Government is spending more money on the economy, which adds liquidity.
If you are using TradingView, you can view them by typing these in:
- Fed's Balance Sheet: United States Central Bank Balance Sheet ($USCBBS)
- Fed's Overnight Reverse Repo at NY Fed (FRED:RRPONTSYD)
- US Treasury General Account with NY Fed (FRED:WTREGEN)
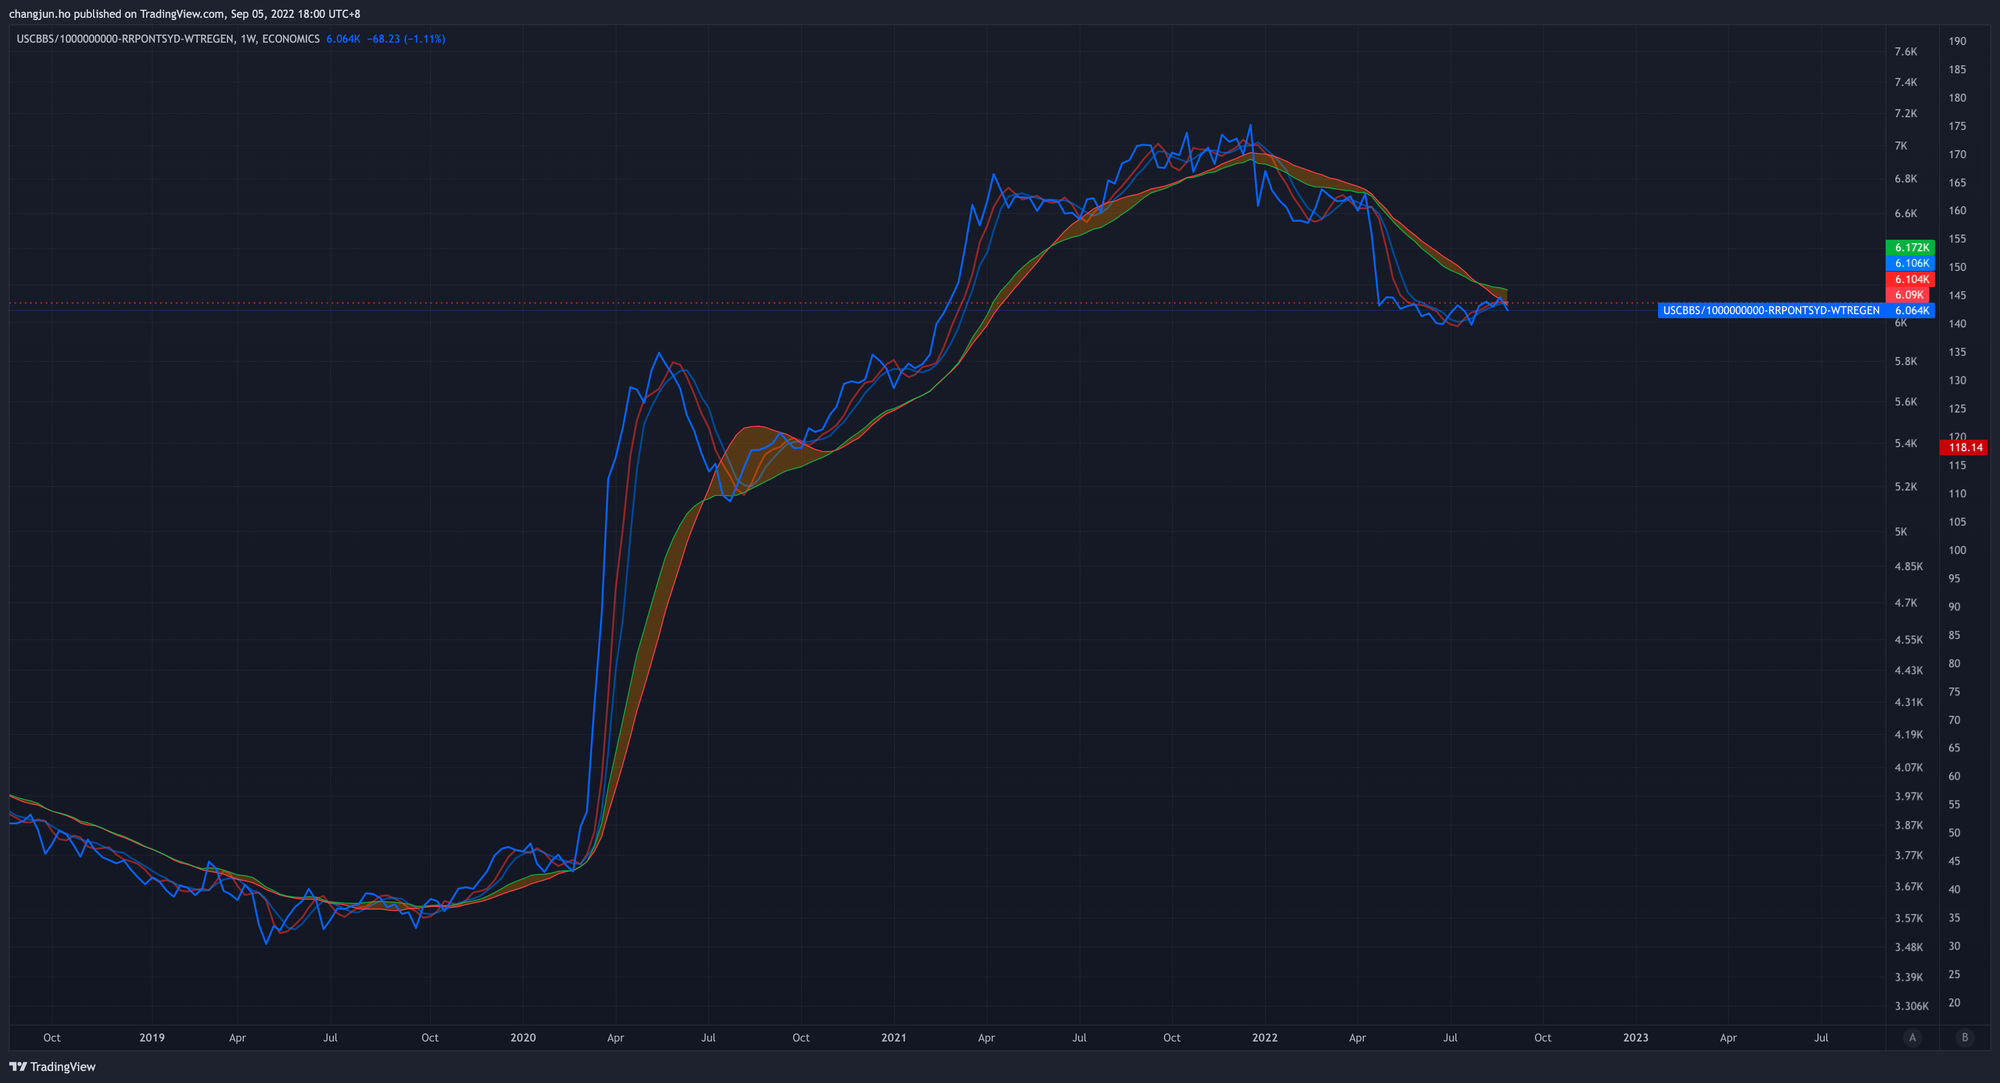
Alternatively, you can combine all of them together with this formula: ECONOMICS:USCBBS/1000000000-FRED:RRPONTSYD-FRED:WTREGEN
As you can see, US liquidity has topped out in December 2021 and was rejected at the 20 weekly moving average previously and is now facing it again. If the trend continues, it is likely to get rejected which is bearish for the market.
One of the key important factors for looking at US liquidity is also the US Treasuries maturity. Starting September, the Fed has stated that they will be tightening by $90 billion a month. Most of this will initially be simply allowing existing US Treasuries to mature without rolling them (buying back).
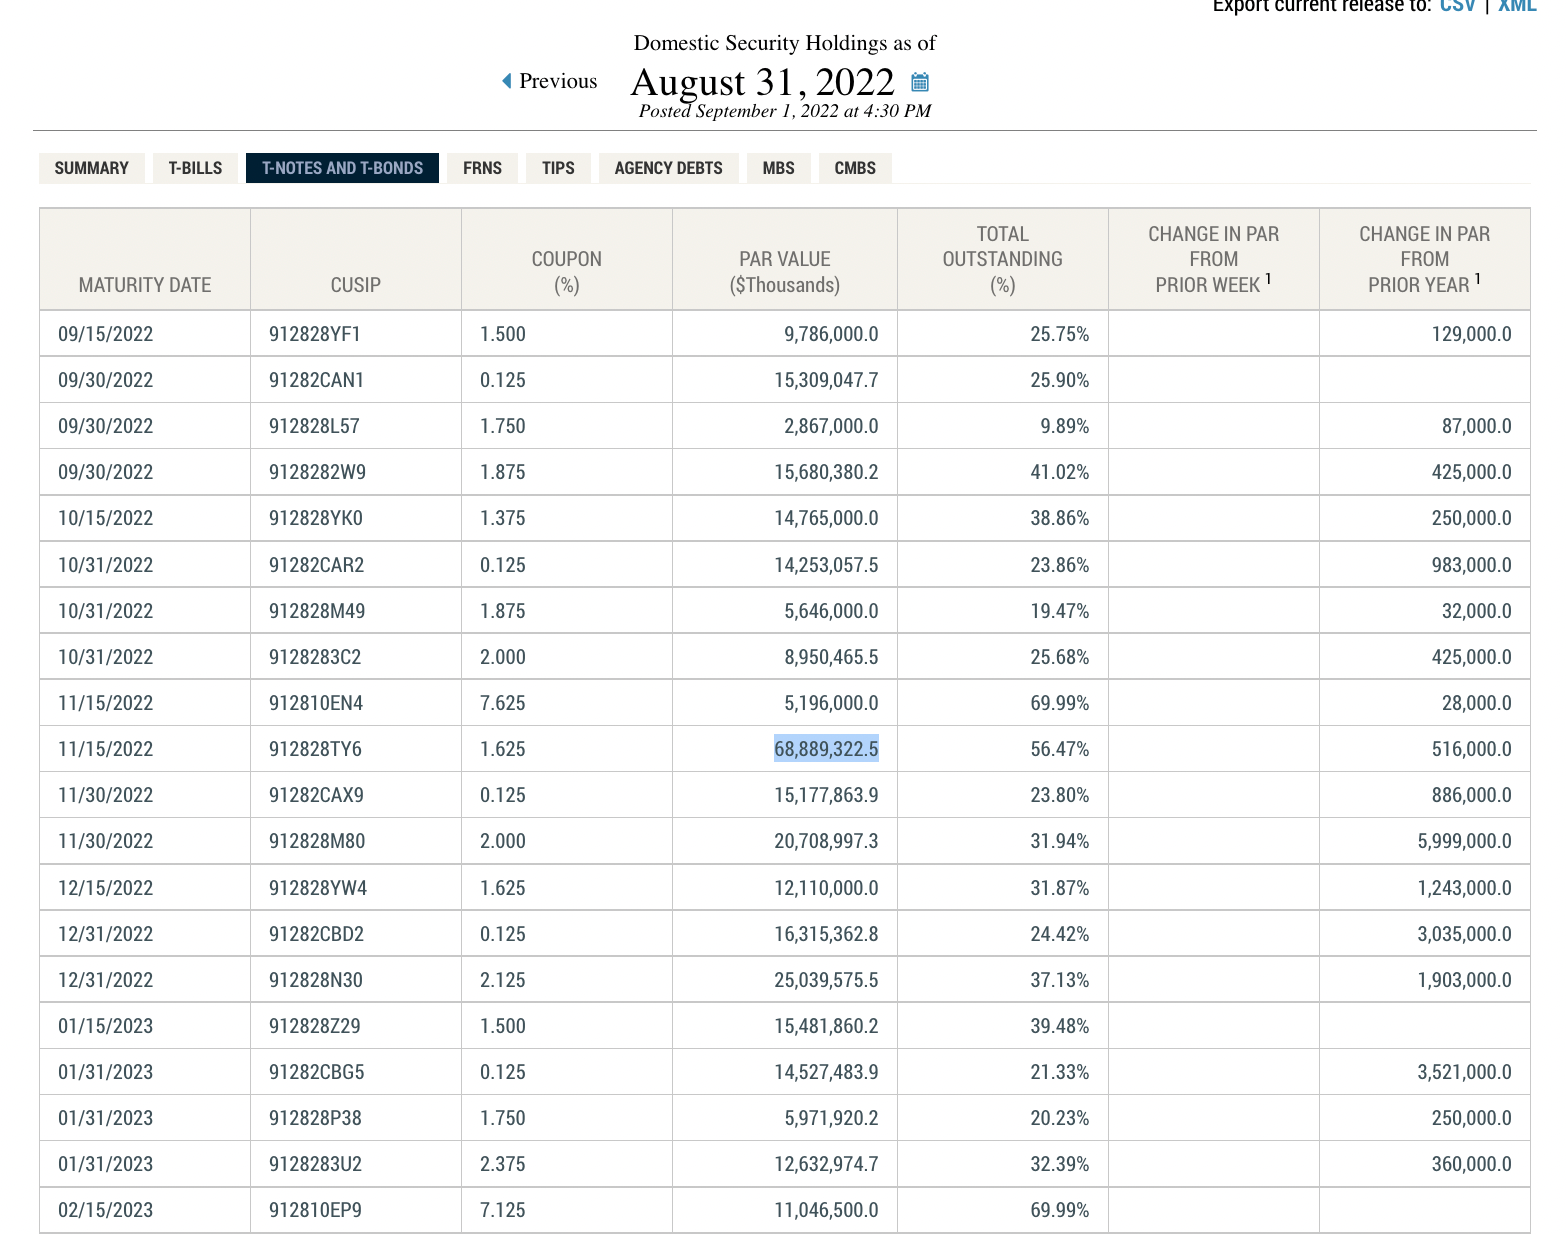
Fortunately, the dates are public and you can observe in advance when the big maturities are. For US Treasury Bonds maturity dates, you can visit this website:

Here you can see the Par Value of the Treasury notes maturing on which dates, and when you see a big number, it is a sign that liquidity may be dropping steeply.
In summary, if the dollar liquidity goes down, assets go down in general, especially crypto, and the opposite is true too, when we see liquidity starts going up, it may be time to start bidding on assets.
US Interest Rates
The interest rate of the USD directly impacts the demand of the dollar and therefore the strength of the dollar.
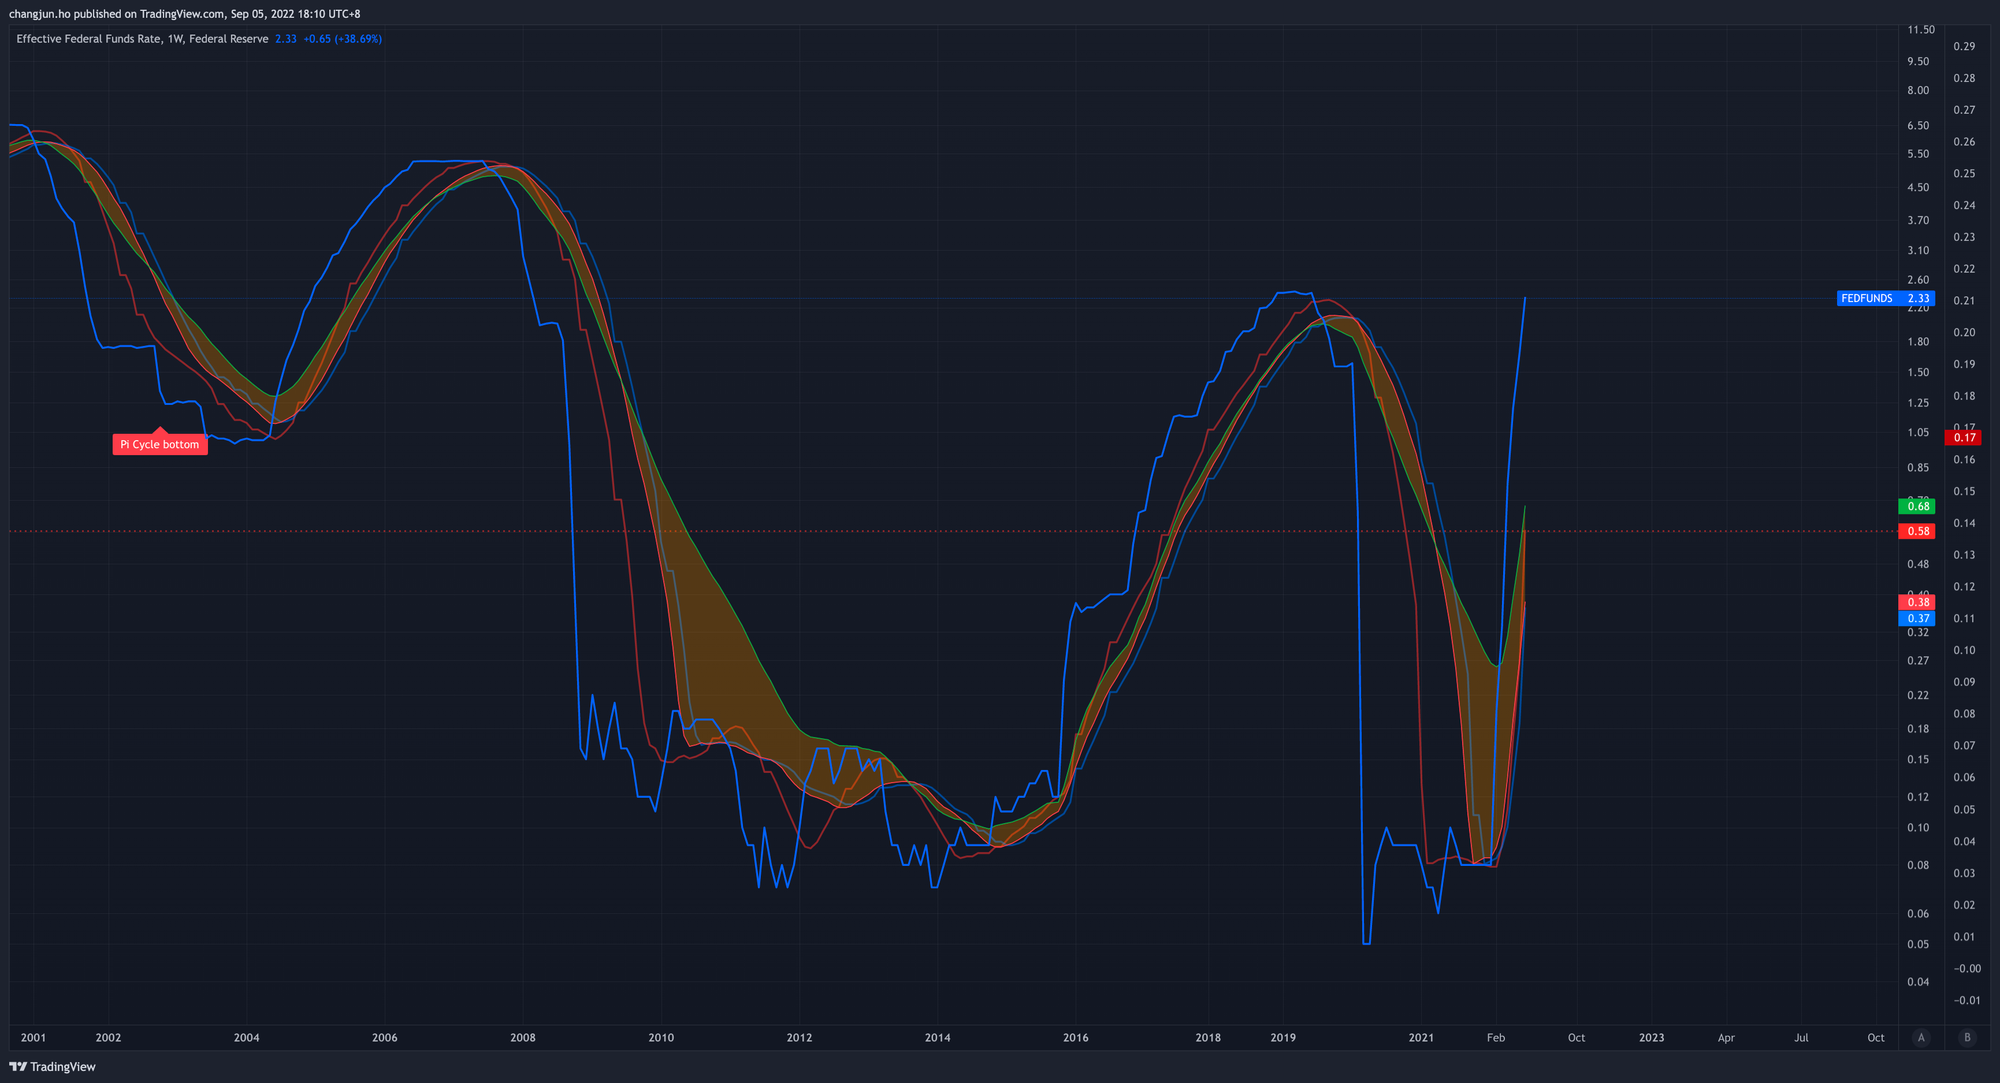
With inflation at historical levels, the Feds are determined to create price stability by hiking interest rate. It is currently around 2.33% and they have stated that they will increase it to 4% at least.
When the Fed increases the federal funds rate, it increases interest rates throughout the economy. Just like higher APY attracts TVL, higher US interest rates attract capital and money from investors worldwide to buy the USD, increasing the strength of the dollar.
A stronger dollar, as mentioned previously, is bearish for risk assets in general, and with inflation remaining high not just in the USA but the rest of the world, it is likely the dollar stays strong internationally.
The upcoming FOMC meeting on 22 Sep will determine the next interest rate hike, and it looks like the probability is currently towards a 75 bps hike compared to a 50 bps hike. The higher the hike, the more bearish it is for the markets. However this prediction is highly dependent on market data and the upcoming CPI report will help to better determine how much the Fed will hike.
You can view the interest rate prediction here: https://www.cmegroup.com/trading/interest-rates/countdown-to-fomc.html
You can also view future Fed funds rates on TradingView using the ticker CBOT:ZQ and deducting 100 from that. We can start to witness a decrease in future interest rates around the first half of 2023 which can be a potential bottom for the markets as well.
Conclusion
We can use the strength of the dollar, US liquidity, and interest rate expectations to look for bias in direction before deciding to long or short a token.
If the DXY is on an uptrend, liquidity is on a downtrend, and the expected interest rate is going up, the USD is getting stronger which is bearish for risk assets, therefore we can be looking for shorts and vice versa.
However, do take note that the fundamentals of each project affect the prices as well, so do research on the projects before taking any trades.