
Crypto is one the most volatile asset class, making it suitable for swing trading. When done properly, often using the help of certain indicators, it can be very profitable and is suitable any levels of traders, from beginners to experts.
The market cap of stablecoins has climbing over 10x in just a few years, becoming a cornerstone of crypto. Seeing the importance of stablecoins in crypto today, how can we use it as an indicator for our swing trading strategy?
In this article, we will explore how we can use this metric in our swing trading.
What is Swing Trading?
Before we explore how this is done, let's go through a brief example of what is swing trading.
The crux of swing trading is to trade from an area of support to an area of resistance. It is different from day trading because positions can be held overnight and can be kept for days, weeks, or even months!
The goal of swing traders is to catch a big 'swing', essentially where the next major resistance or support that the price is trending towards next, typically a 5% move or sometimes even a double digit percentage move.
In addition to relying on support or resistance levels, swing traders also often use a few indicators to determine entries and exits whenever there is a confluence of signals. Confluence is when multiple signals agree instead of being in conflict, increasing your probability of success in trading.
Examples of indicators can range from Average True Range (ATR), Relative Strength Index (RSI), Moving Average Convergence Divergence (MACD), Bollinger Bands, or even interesting indicators like the ratio of stablecoins market cap against the total crypto market cap.
What is a swing?
A swing is a retracement or a rally that is typically in a defined trend or pattern. It is important that it have some kind of historical data, be it days, weeks, months, or even years. The more respected the pattern, the better it is for swing trading.
Successful traders typically wait for prices to reach their desired level of resistance or support levels of a defined trend before entering in a long or short position to ensure they have a good risk/reward ratio in their swing trade.
Market cap of stablecoins
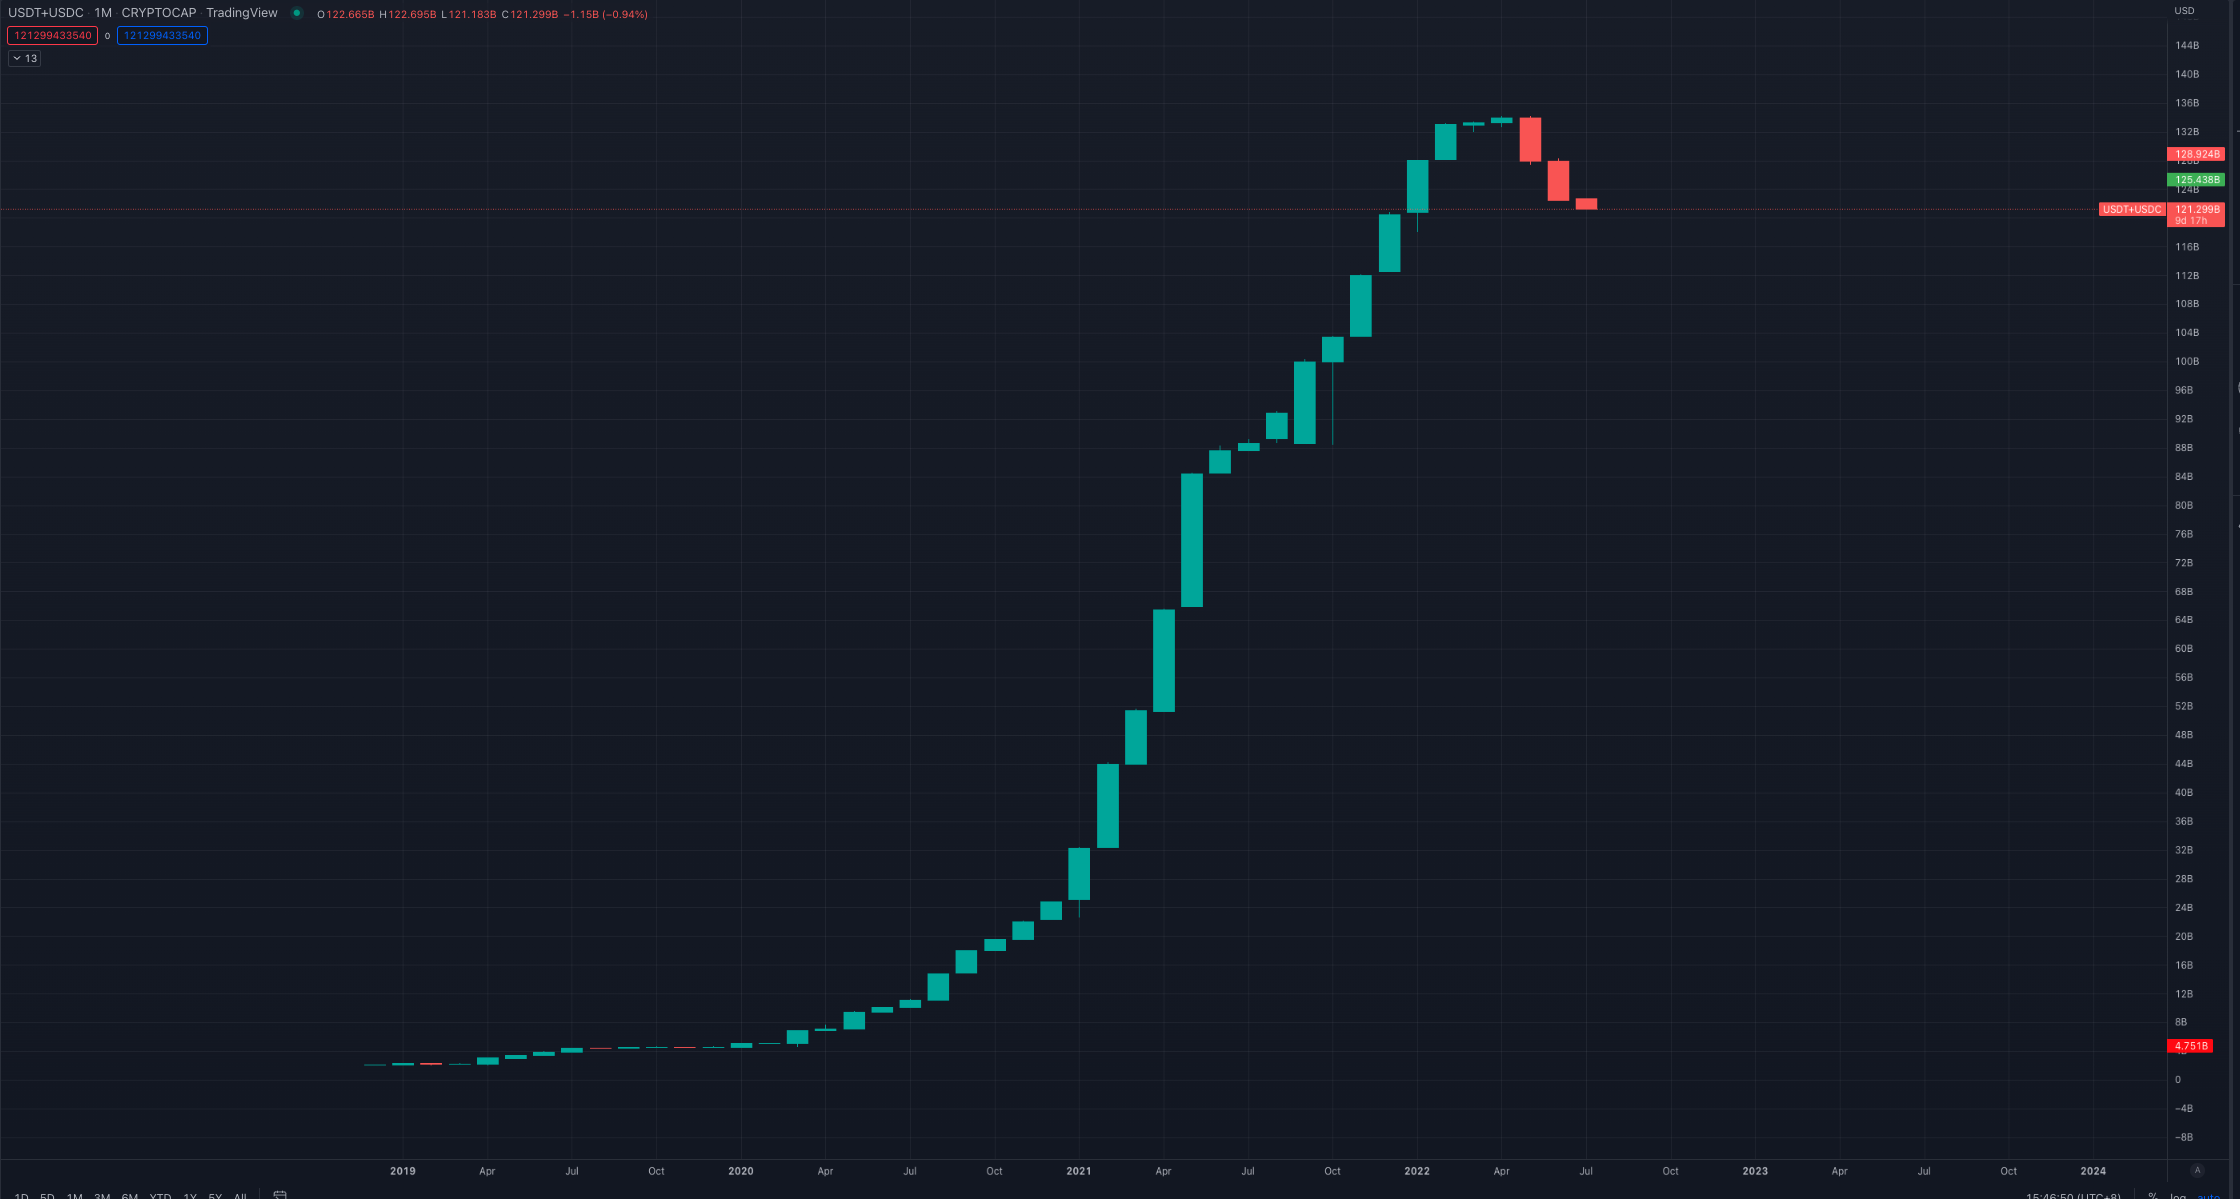
Looking at the market cap of the top two stablecoins (USDC+USDT), we can see that the non-stop rally it had has come to an end with 3 months of downtrend.
This downtrend is caused by redeeming stablecoins into fiat, which takes liquidity out of the crypto markets. This partially explains why crypto assets fell steeply during this period, as the lower the liquidity, the faster prices move.
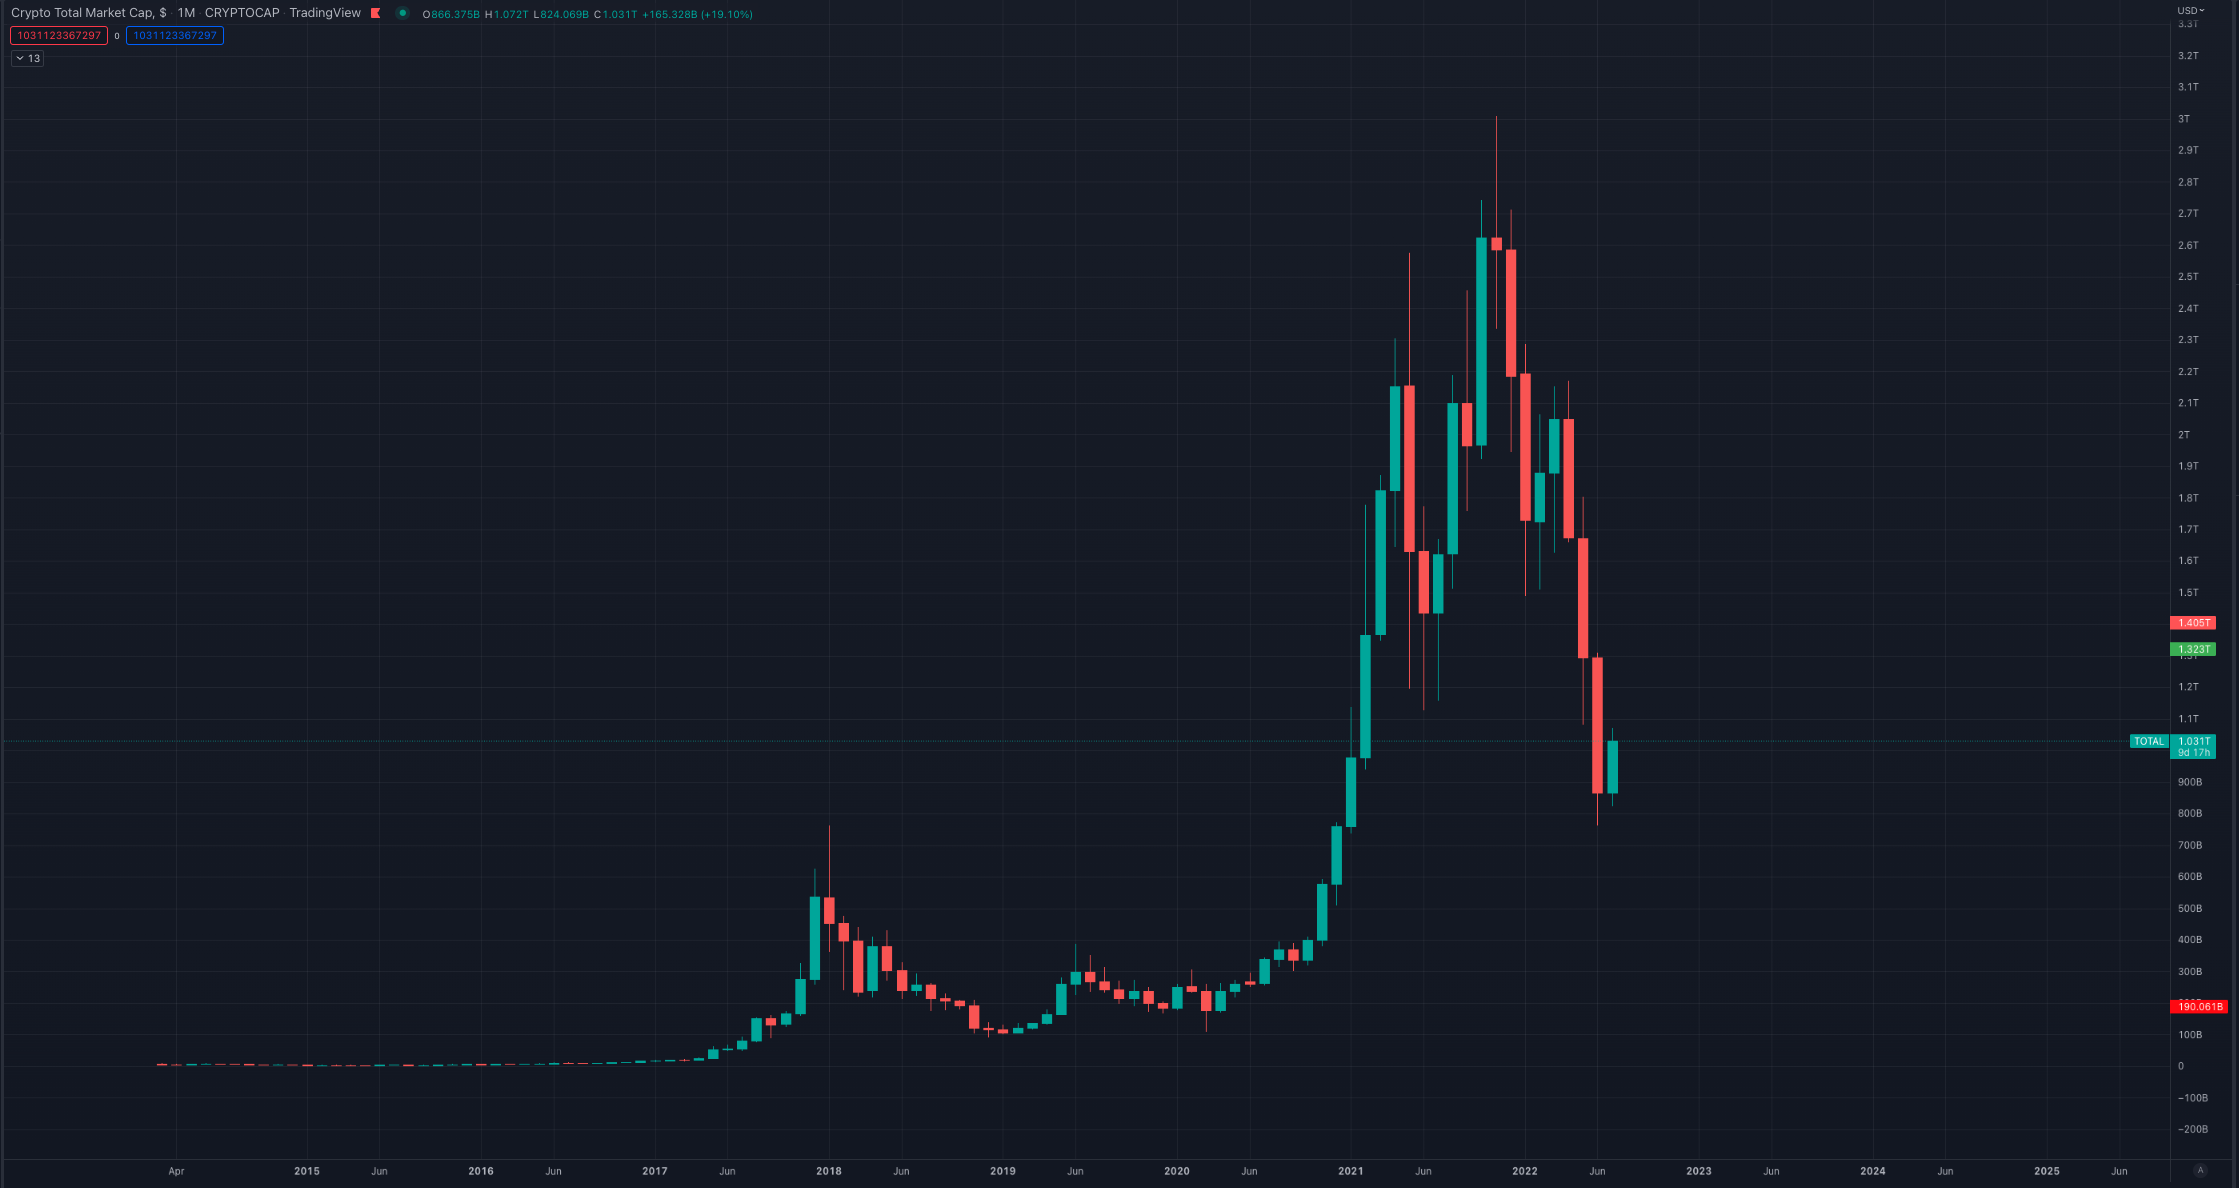
Looking at the total crypto market cap, which includes stablecoins, the market cap has come down by over 60% since November of 2021.
What if we take the two charts together? We actually get a pretty interesting trend of market cap against total crypto market cap oscillating in a defined pattern since 2019. But what does it represent?
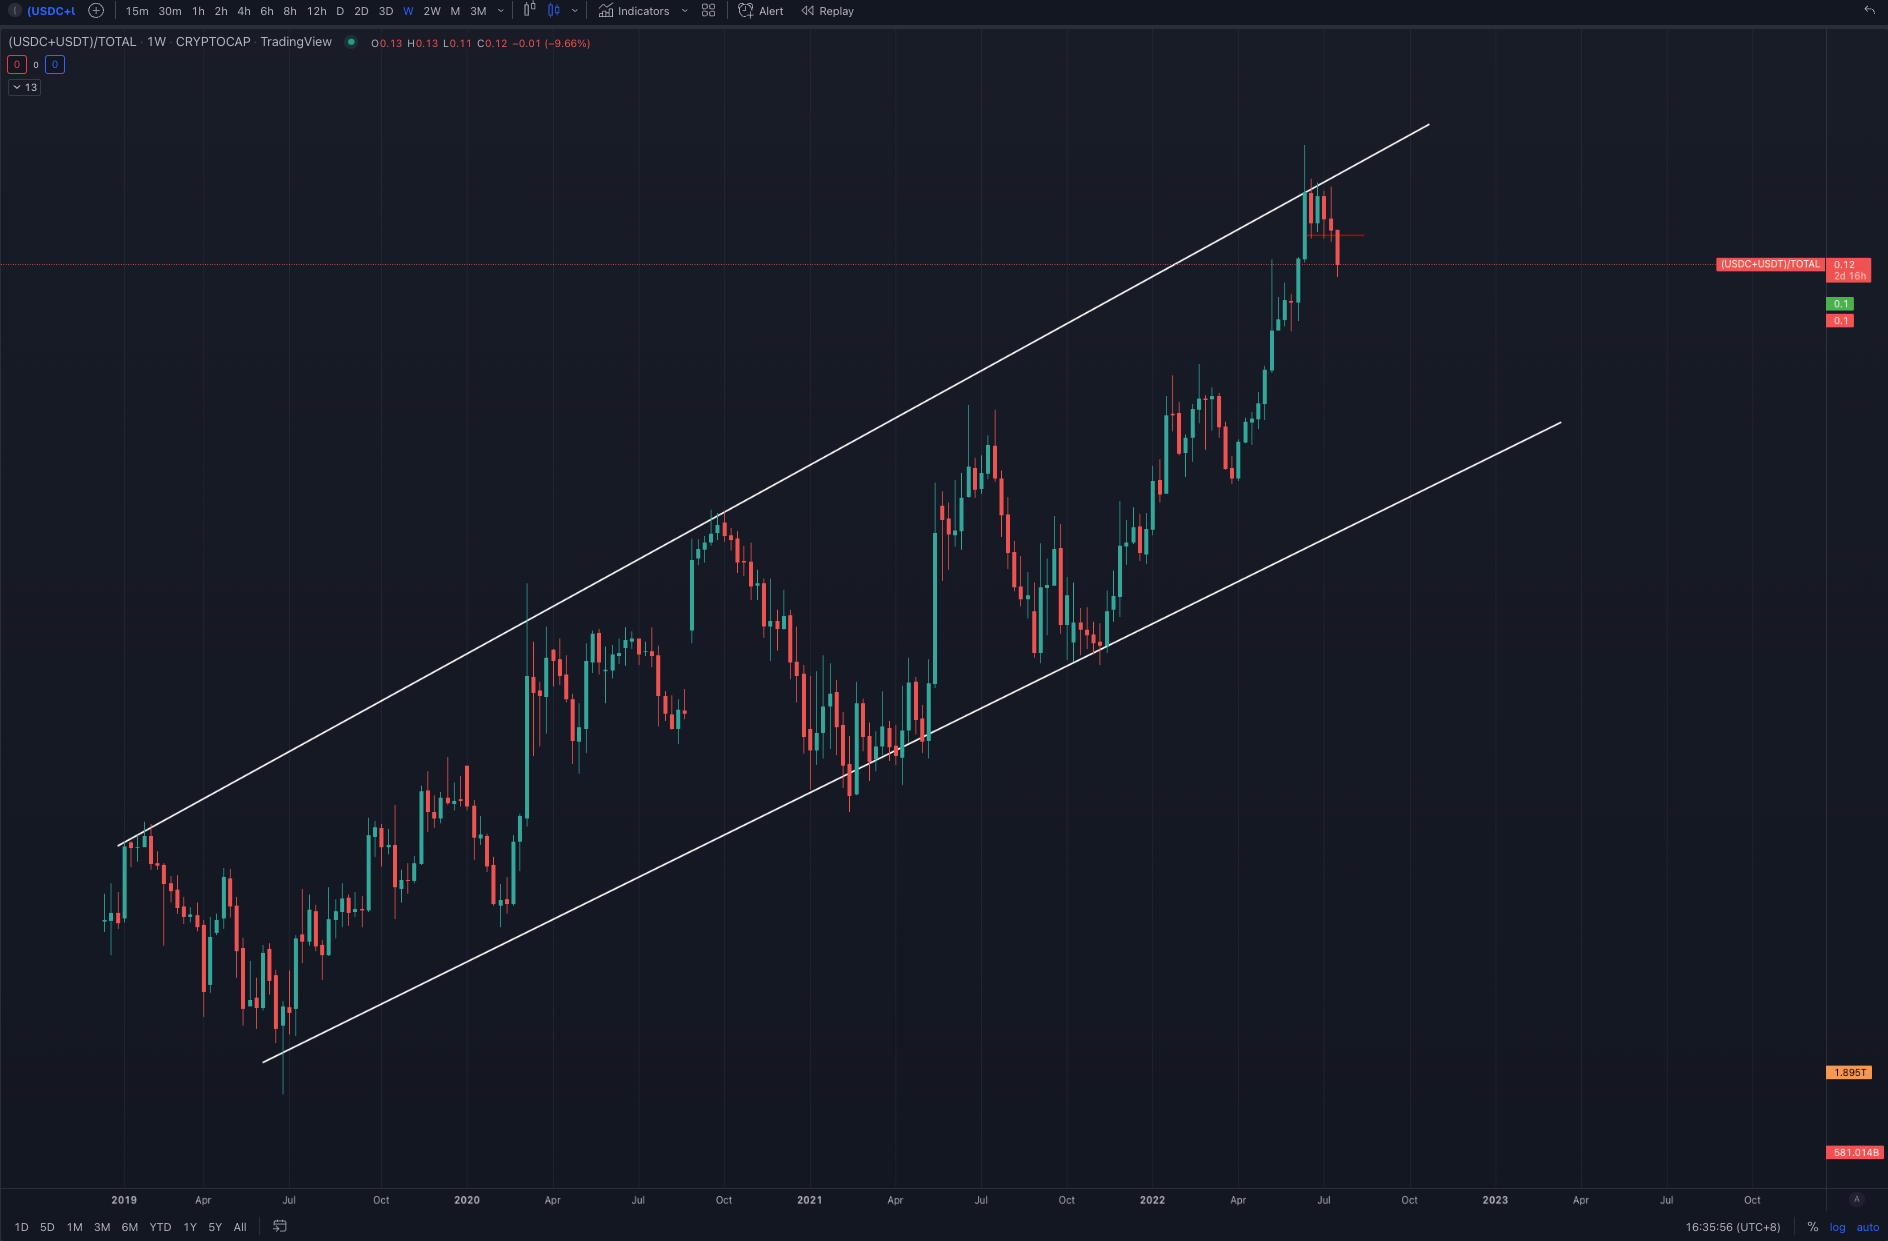
In short, if this chart goes up, it means that crypto prices are going down, and if this chart goes down, it means that crypto is going up.
What is interesting is that the chart has been respecting the trend lines, offering a good signal to long or short the market whenever the chart bounces off the trend lines. Now that it is going down, traders can have a bias going long with this trend.
However, the chart doesn't have a clean swing up and down, so it is important to stay nimble if the chart starts to reverse, and manage risk accordingly.
Conclusion
There are many ways to swing trade, and a successful swing traders look for a confluence of indicators to determine the next trade in order to achieve a higher success rate.
This chart will just be one of the many indicators in a swing trader's toolset until the trend breaks. You know what they say, the trend is your friend until the end.