
Anyone that has traded crypto markets would know that it is highly volatile. This also means that if you are a day trader, you can easily get stopped out by wicks when setting orders if your stop losses are too tight, creating losing streaks.
There are couple of indicators that you can use to assist with setting stop losses, in this article, we will explore the Average True Range (ATR) indicator.
Average true range (ATR) is a volatility indicator that shows an asset's average movement over a specified time period.
This is more commonly used for day traders to assess if they want to execute a trade, and helps to determine where to set stop losses and take profits.
ATR Indicator Analysis
On Demex, you can view the ATR indicator by clicking on the 'fx' button on the time interval row.
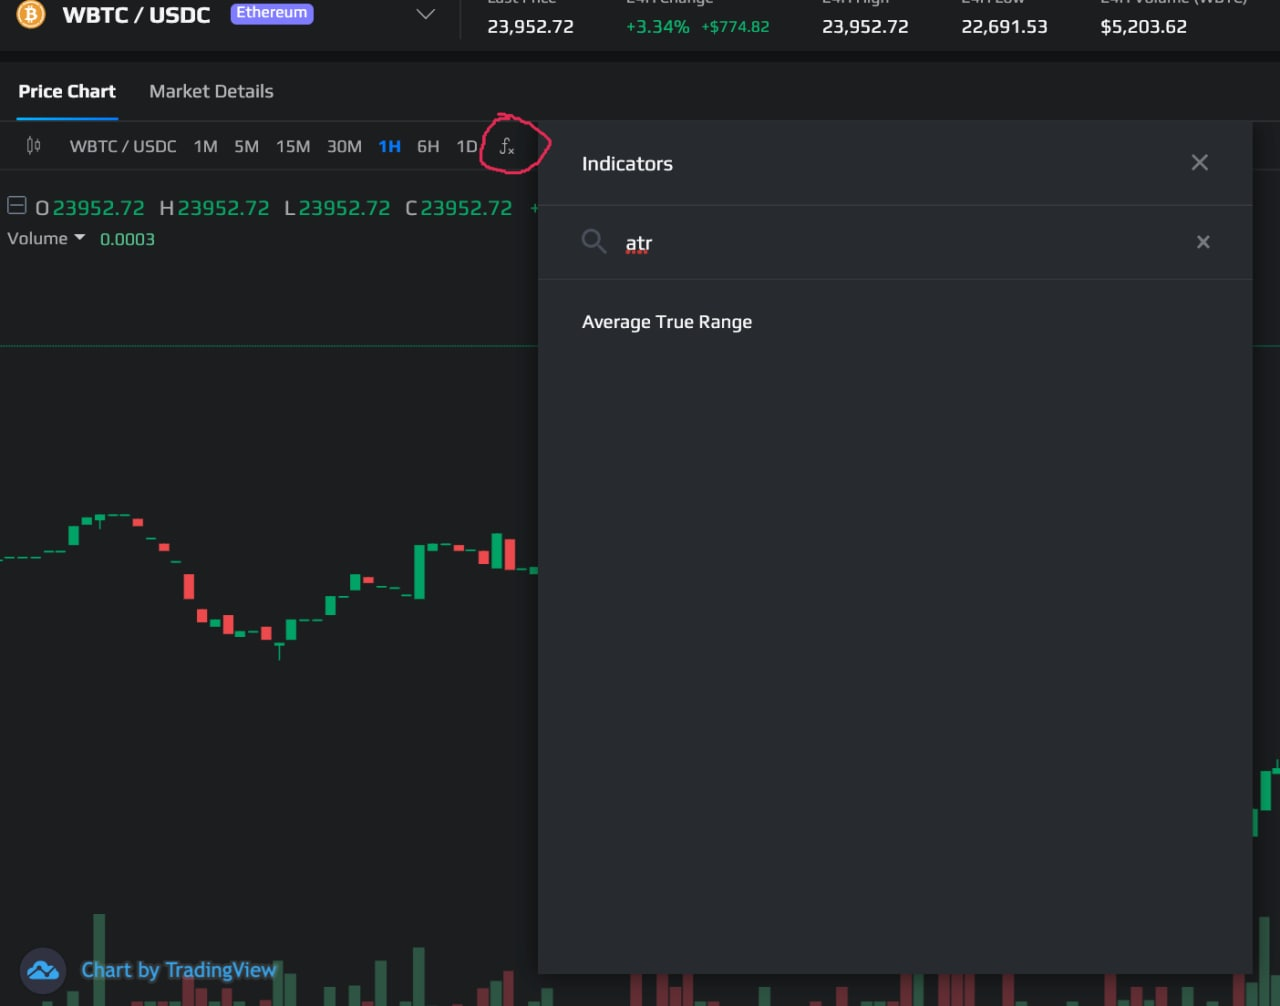
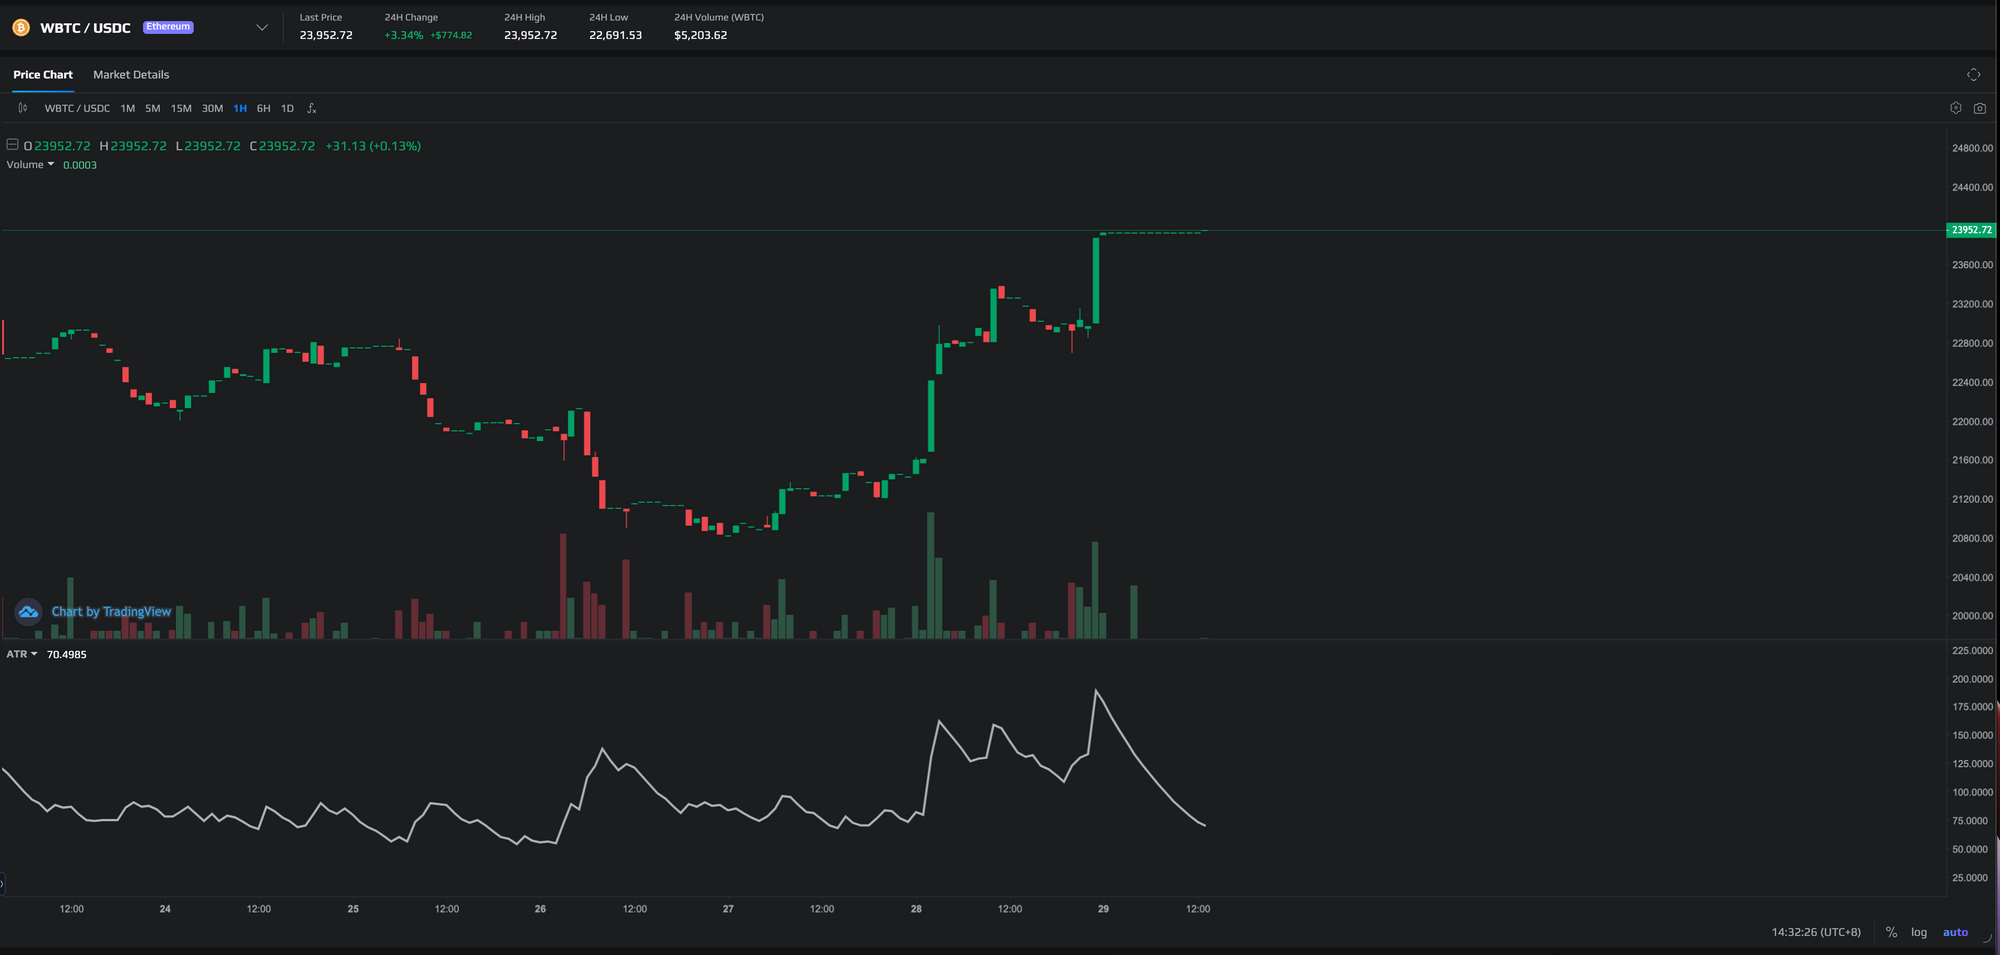
The ATR indicator will appear. It shows swings of ups and downs as an asset's price changes. With each passing time interval, a new ATR reading is computed.
For example, on the minute chart, every minute, a new reading is computed and shown, and the same applies on a daily chart. In order to show traders how volatility changes over time, all of these readings are displayed forming a continuous line, as shown below with the white line.
ATR Computation
To compute the ATR, you must first determine a series of true ranges to manually compute the ATR. This is known as the trading range (TR) which defaults to 14.
Although the standard range to use with an ATR indicator is 14, you can tailor this to fit your strategy.
If you want to place greater emphasis on recent levels of volatility, you can use a lower number. If you are using ATR for longer-term trades, you can use a larger number to take a broader measurement for more safety.
The TR for a given trading period is the greatest of the following:
- Current high minus the prior close
- Current low minus the prior close
- Current high minus the current low
It doesn't matter if the number is positive or negative. The calculation takes into account the highest absolute value. The values are recorded for each period, and then an average is taken.
Current ATR = ((Prior ATR x 13) + Current TR) / 14)
The Benefits of ATR for Trading Decisions
The information on how much an asset generally moves over a specific time period can be used by Day Traders to decide whether to attempt to trade.
Let's go through an example (sorry for my horrible hand writing).
Setting stop losses with ATR
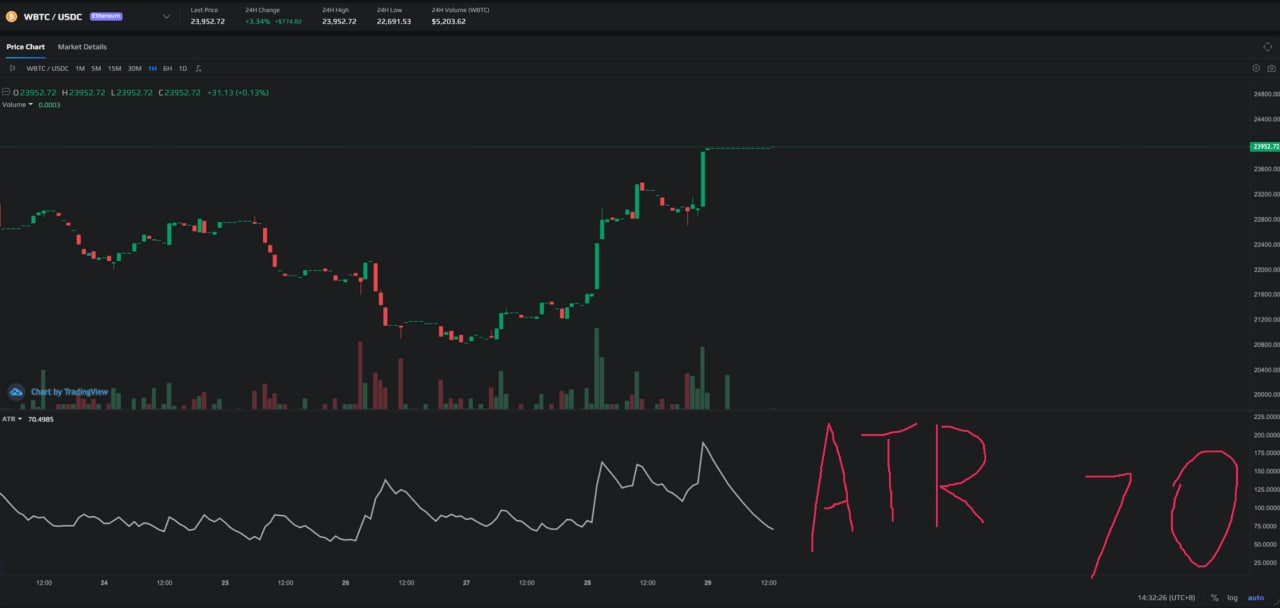
Using this BTC chart on the one hour time interval, the ATR is currently at 70. If you got a sell signal from an indicator that you are using, you can use the ATR to determine stop losses or entries.
Because ATR means the average range in that time interval, if the price is going up close to $70 from the opening of the current candle, and your strategy sends a sell signal, you can set a short entry as it is less likely (but not impossible) that it will go above the existing price range within the time interval.
This would make the short entry around $24070. For your stop loss, you can also consider another 1 or 2 ATR above your short entry, making the stop loss $24140. If that feels too tight as crypto is volatile, you can increase the stop loss to even 3x the ATR for more buffer, but it also results in higher losses.
Note: It is not recommended to use ATR in isolation and it is best to use with a confluence of other indicators.
Alternatively, if your strategy prints a buy entry, but the price has already moved up by an amount close to the average true range, you might consider not taking it as the odds might be against you, and wait for the price to go back closer to the opening for better risk reward.
In terms of profit-taking, it is best to have at least a 2x risk reward ratio. Meaning if you are going to be losing $100 when you hit your stop loss, then you should be looking to set a take profit of at least $200 as well.
You should also review historical ATR readings to see how accurately it performs and how much of a multiplier you should set. If using a 2x multiplier of an ATR allows you to avoid getting stopped out on most wicks, you should adapt accordingly for individual assets.
Conclusion
Due to the volatility of crypto, knowing how to set proper entries and stop losses, and not chase prices, is half the battle won for day traders.
Using the ATR indicator can be a systematic way of deciding when and how to set entry positions, as well as stop losses and profit taking targets, allowing you to have a less emotional and more objective day trading experience.