Technical indicators are largely a self-fulfilling prophecy. The more people that use an indicator and believe in it, the more likely it is to be accurate, apart from market manipulation.
Hence, it is important to know the commonly used indicators, and one of the most popular ones is the Relative Strength Index.
This will be an indepth guide on the RSI indicator.
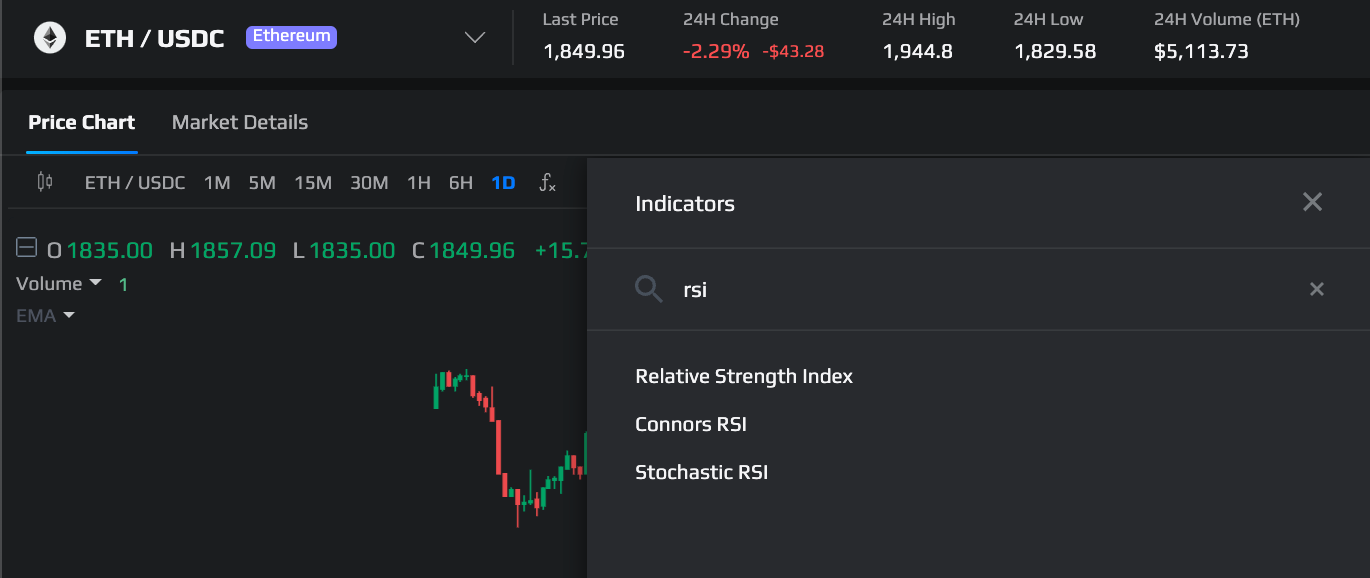
Before we start, you can find the RSI indicator on Demex by clicking on the ƒ𝑥 icon at the same row of the time range and typing in 'RSI' to find it.
What is the Relative Strength Index (RSI) indicator?
The relative strength index (RSI) is a momentum indicator developed by J. Welles Wilder Jr.
You can think of momentum indicators as telling you where the price wants to go. If a momentum indicator is in a downtrend, it tells you that the price wants to go down, vice versa.
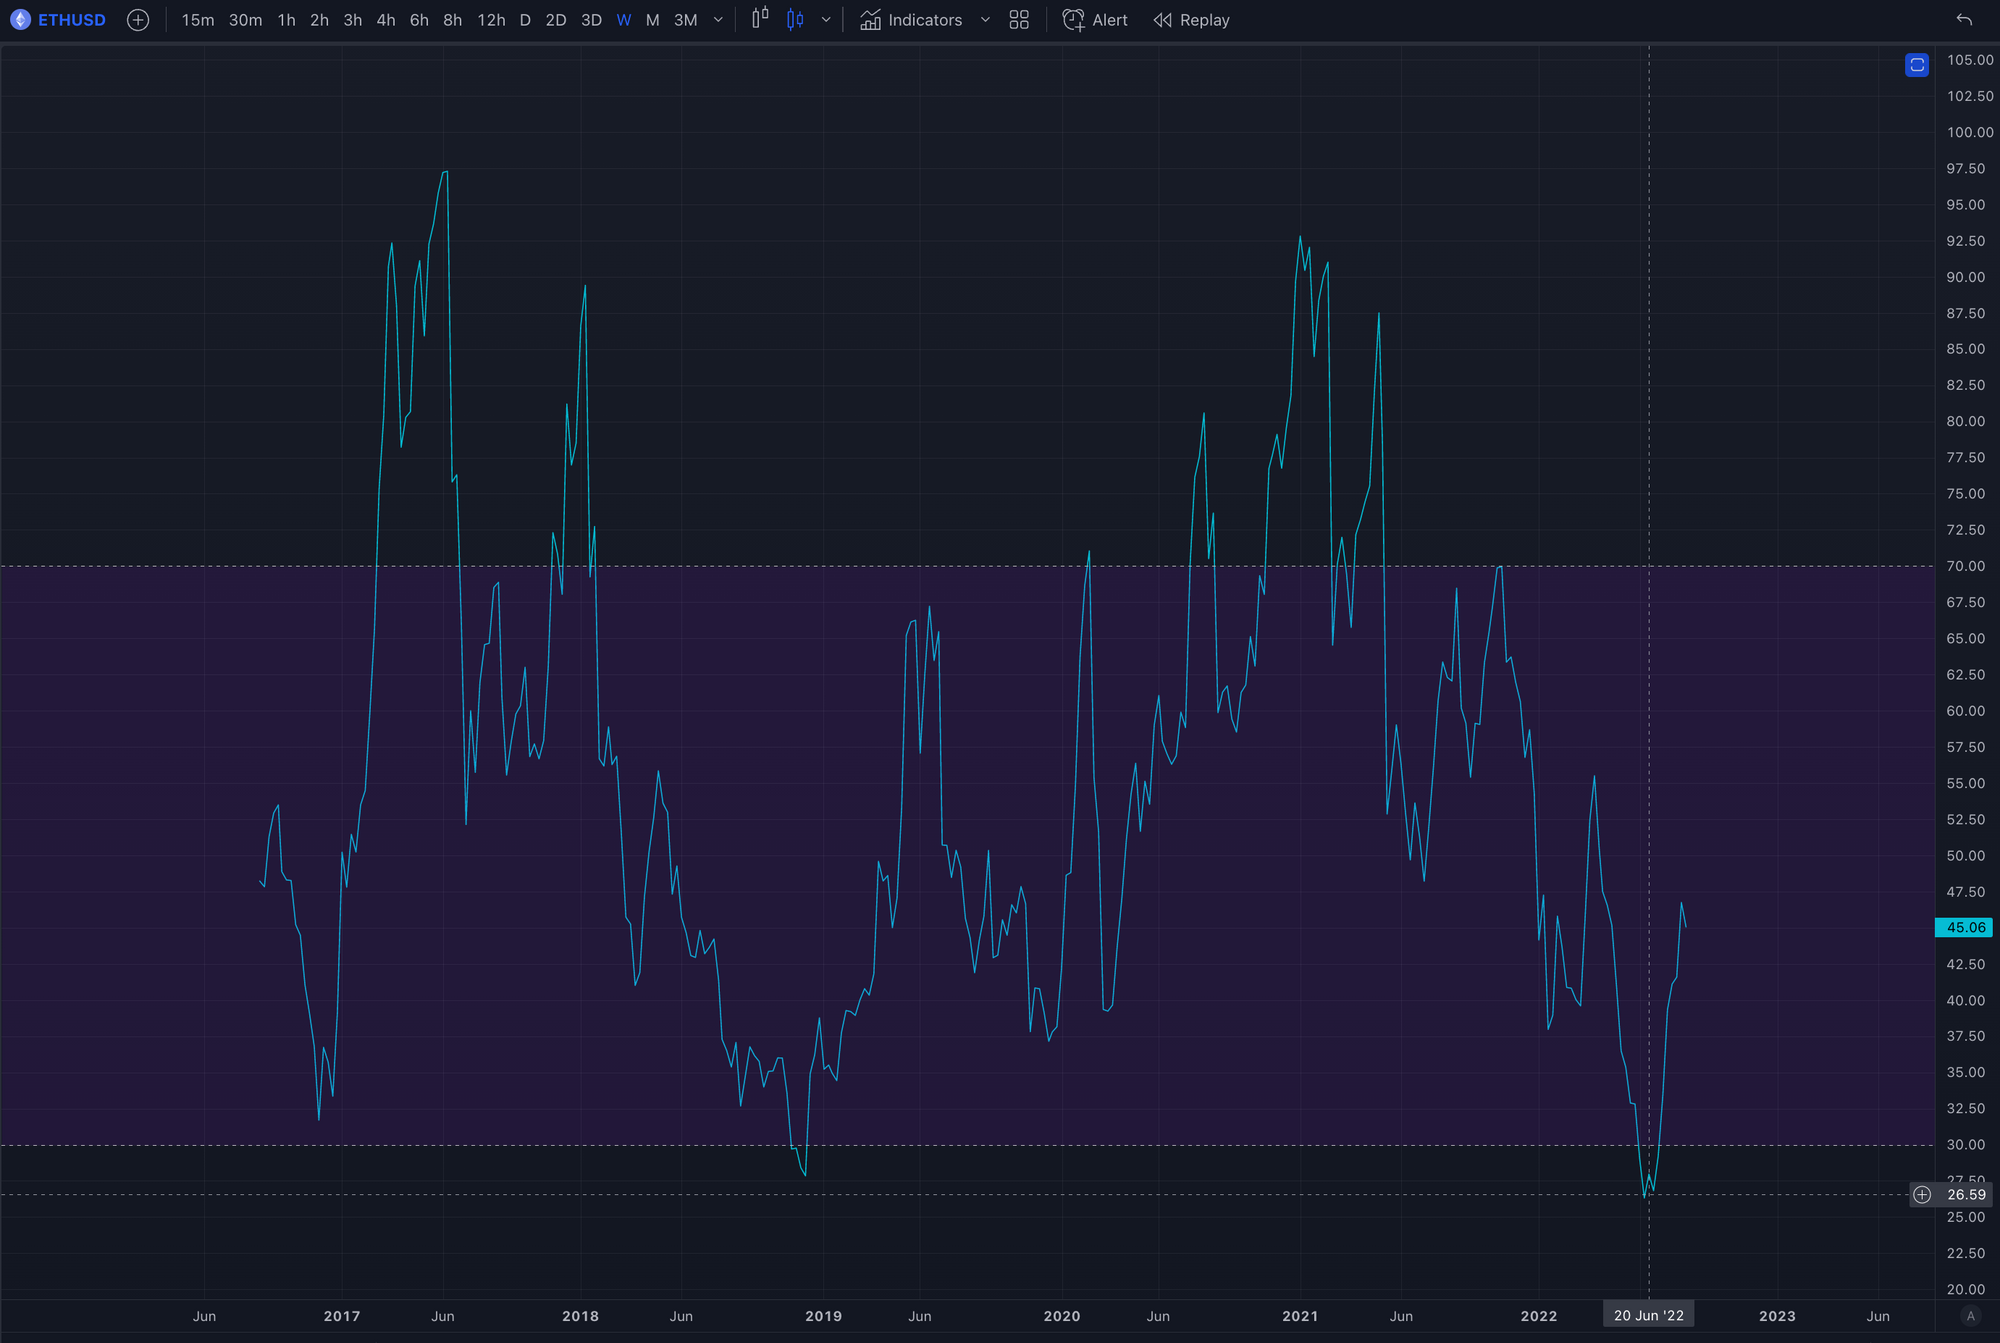
The RSI measures the speed and magnitude of an asset's recent price changes. It is displayed as an oscillator (a line graph), meaning it oscillates from a scale of zero to 100. This helps to evaluate whether it is overbought or oversold in that particular time range. Traditionally, an RSI reading of 70 or above indicates an overbought situation. A reading of 30 or below indicates an oversold condition.
Additionally, because of the oscillating nature of the RSI, it is easier to follow for traders when prices are in a ranges, rather than for trending markets.
Why Is RSI Important?
RSI helps traders to predict the price behavior of a token to get an edge over the market. Apart from indicating regions of overbought and oversold which can be useful buy and sell signals, it can also help spot a new trend emerging as well as when a trend is potentially reversing.
It is a classic technical indicator that can be used to supplement other technical indicators to create a more accurate trading strategy.
How to use the RSI for crypto markets
As crypto is more volatile in nature, some adjustments to the RSI indicator can work better as potential entry or exit indicators.
Depending on your token and time range that you trade with, it is recommended to modify your RSI levels to fit the existing trend to make it more useful for you.
Here's a guideline that I use, for time frames between 1 hour to 1 day, an RSI reading of 80 to 90 or above would better indicate an overbought situation. This is because an RSI of 70 can still have a lot of room for the token to climb in price as the RSI goes towards 90 due to short squeezes, FOMO and euphoria which are more common in crypto.
On the otherside, a reading of 25 to 15 or below would better indicate an oversold condition. Similarly this is because an RSI of 30 can still have a lot of room for the token to drop in price as the RSI goes towards 15. On the higher timeframes above 1 day, most bluechip tokens RSI do not drop below 30, hence those can be buying opportunities. However past results are not indicative of future performance.
One thing to note is that the higher the time frame, the more reliable the RSI can be used as an indicator, preferably starting from 1 hr and above.
Using RSI Divergence to predict reversals
A more advance usecase for RSI is to predict when a trend is unsustainable and the price will eventually reverse trend. This is known as RSI divergence.
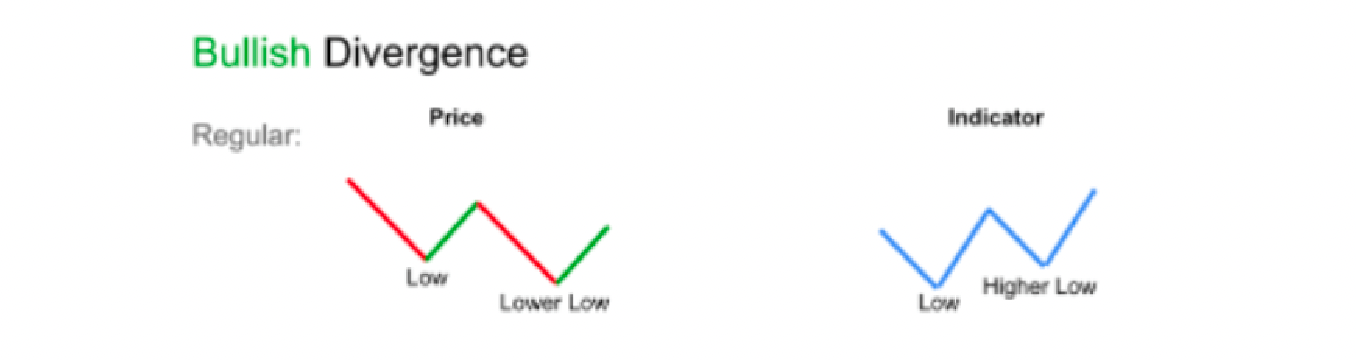
RSI divergence happens when price moves in the opposite direction of the RSI. They can be either a bullish divergence or a bearish divergence.
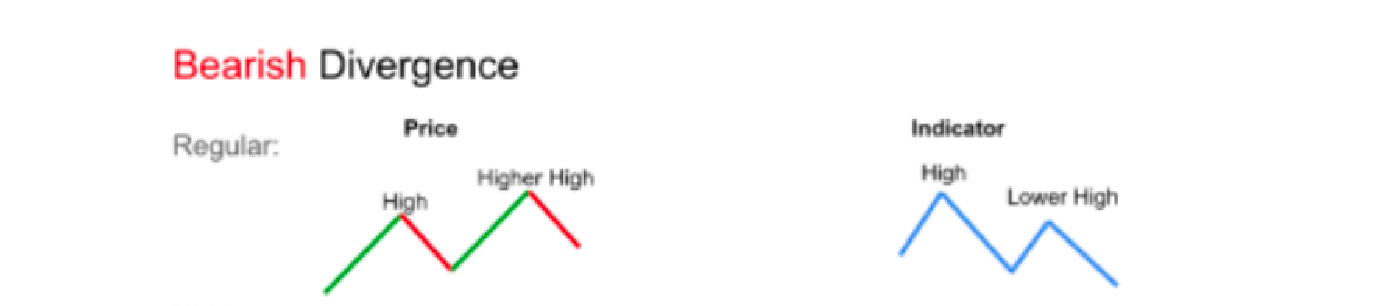
Bearish divergence
For example, if the RSI goes into overbought levels and then proceeds to make a lower high, while the price continues to form a higher high, this is known as a regular bearish divergence. This may indicate slowing bullish momentum which could eventually turn into a bearish reversal.
Bullish divergence
On the otherhand, if the RSI goes into oversold levels and then proceeds to make a higher low, while the price continues to form a lower low, this is known as a regular bullish divergence. This may indicate slowing bullish momentum which could eventually turn into a bullish reversal.
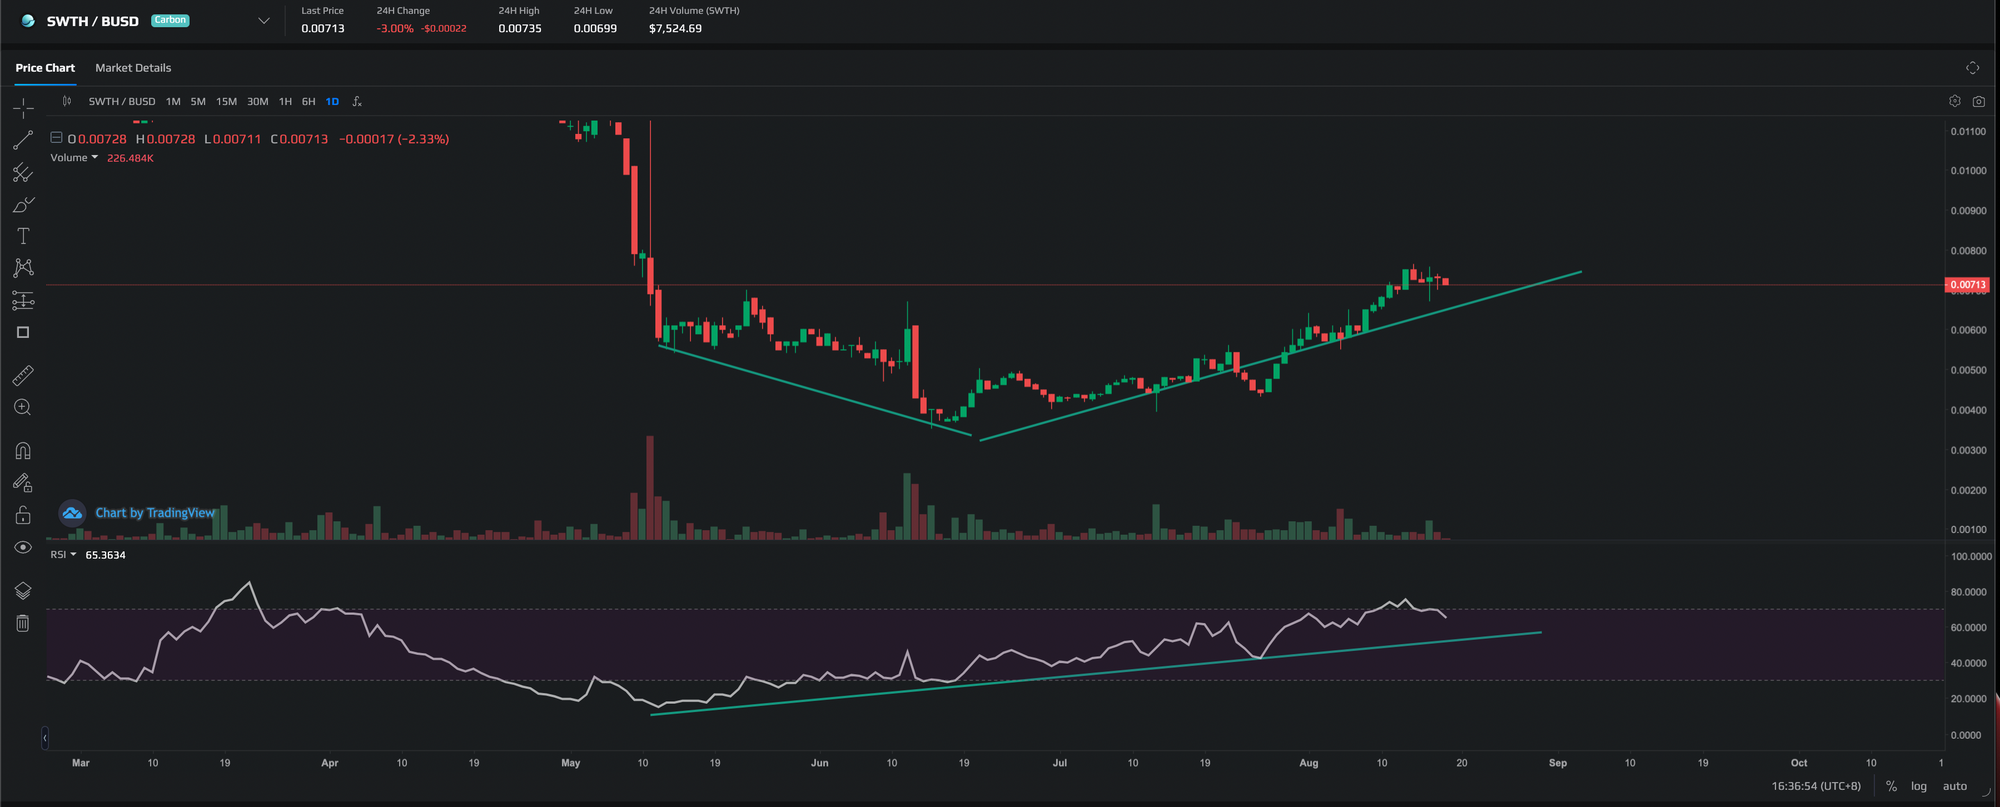
In fact we can see an example of a bullish divergence in our own $SWTH token recently. Price made a new low however the RSI made a new high after entering oversold zones, and prices have since rebounded upwards.
However, not all RSI divergences lead to trend reversals, some lead to trend continuation as well. There are also strong and weak RSI divergences. Let's explore how to differentiate these diveregences in the next section.
Types of RSI Divergence
We have went through the regular divergence, which is the strongest form of divergence to pay attention to as it tends to lead to a reversal.
There are other types of divergences that leads to reversals as well but their signals are not as strong or clear compared to the regular divergence.
Below is a handy summary table to illustrate the different type of divergences and how to spot them.
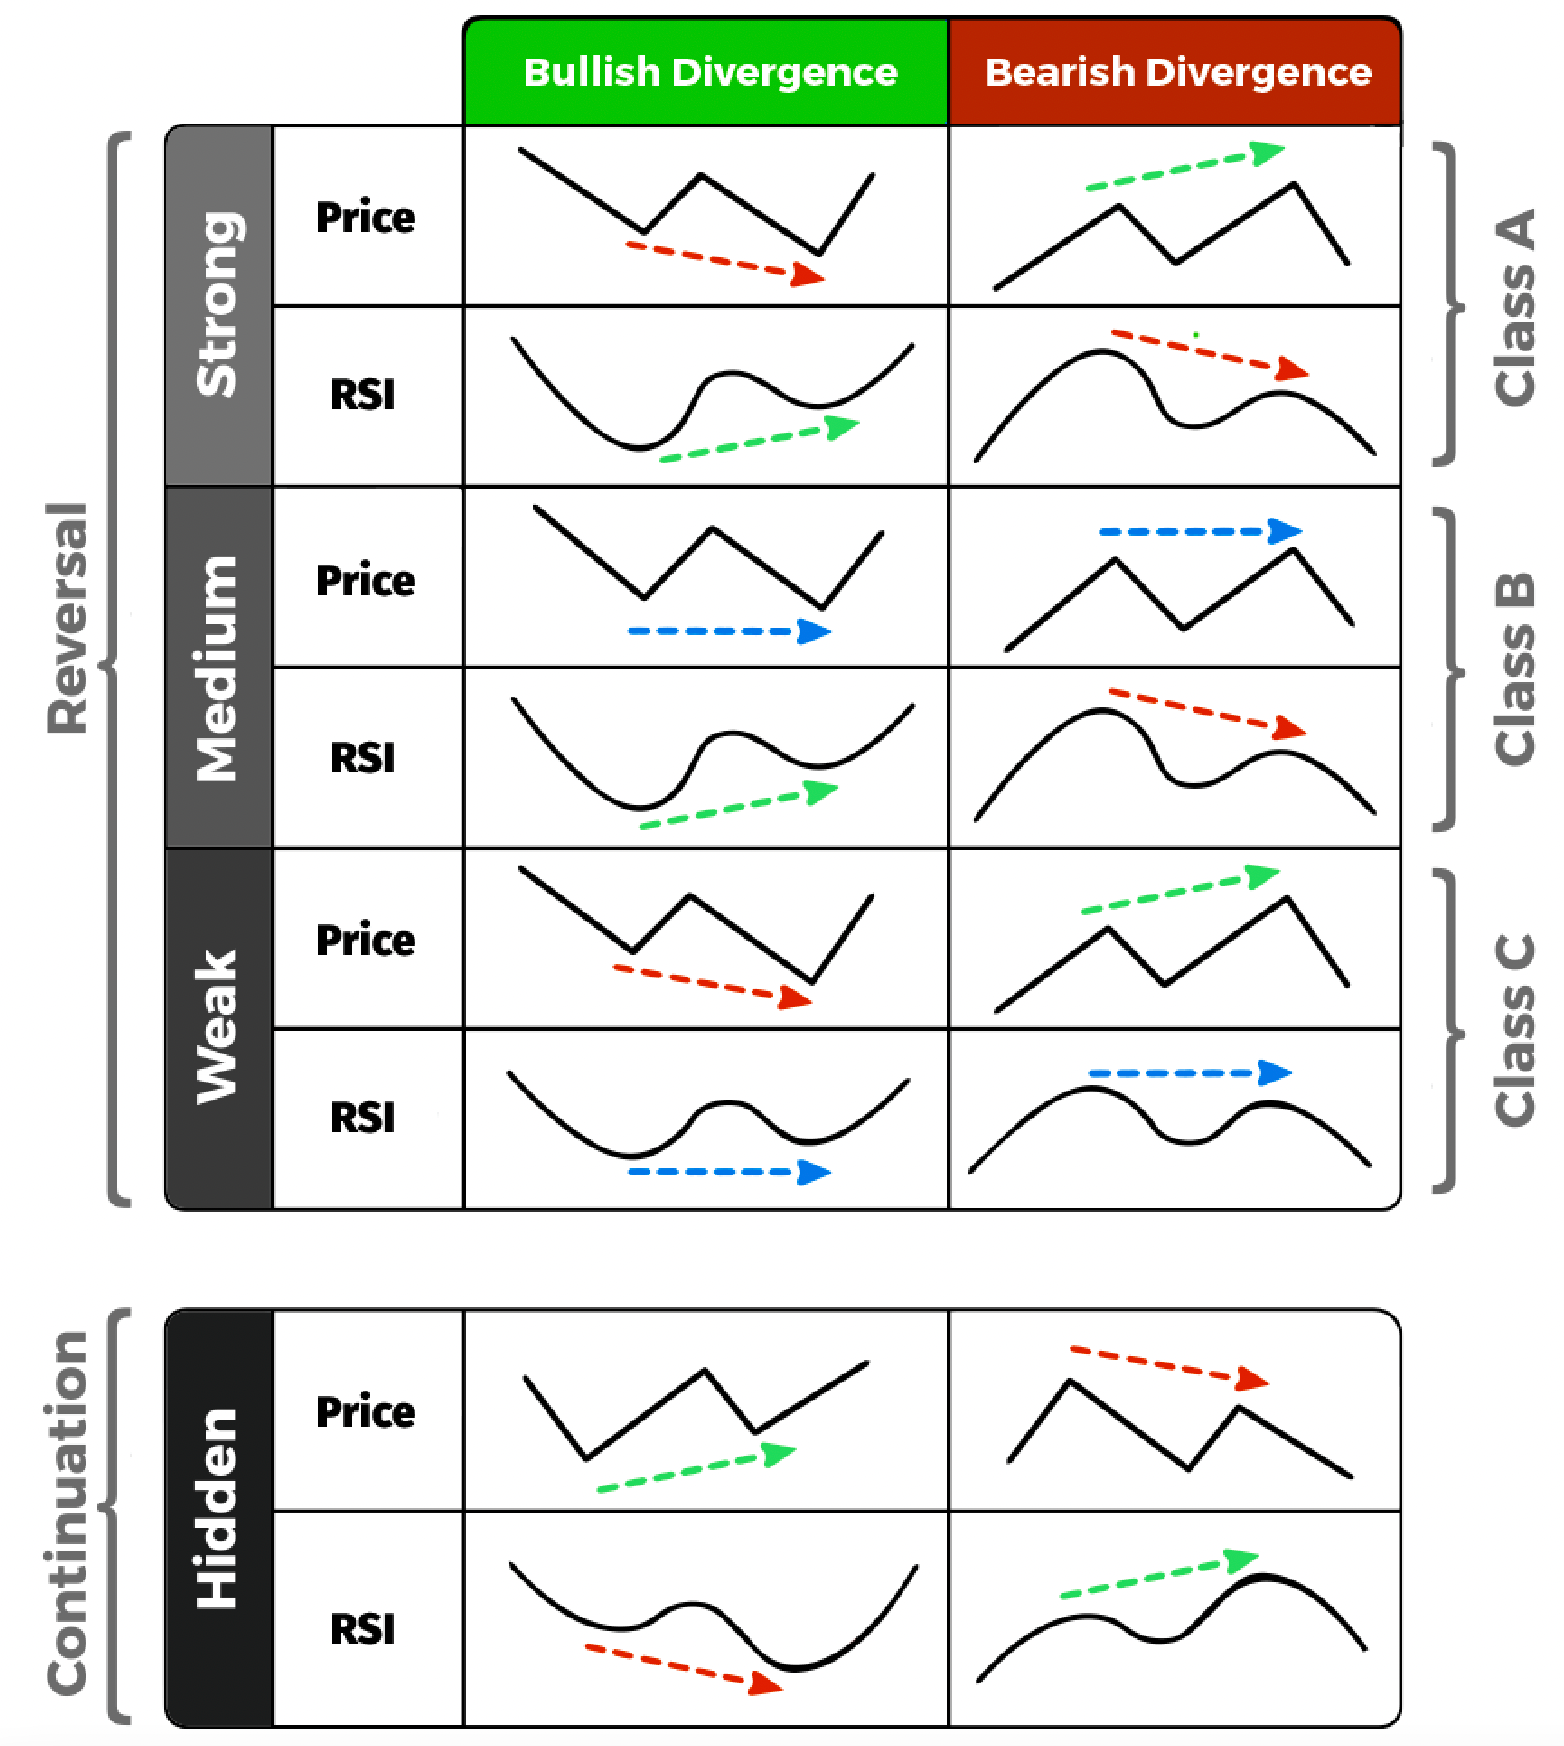
Strong Bullish Divergence
Price makes a lower low but the RSI indicator makes a higher low. This is sometimes referred to as a regular or classic divergence.
Medium Bullish Divergence
Price makes an equal low but the RSI indicator makes a higher low. This is sometimes referred to as an exaggerated divergence.
Weak Bullish Divergence
Price makes a lower low but the RSI indicator makes an equal low. This is sometimes referred to as an exaggerated divergence as well.
Hidden Bullish Divergence
Price makes a higher low but the RSI indicator makes a lower low, but eventually goes back up. This is sometimes referred to as a continuous divergence as it is a continuation pattern.
Strong Bearish Divergence
Price makes a higher high but the RSI indicator makes a lower low. This is sometimes referred to as a regular or classic divergence.
Medium Bearish Divergence
Price makes an equal high but the RSI indicator makes a lower high. This is sometimes referred to as an exaggerated divergence.
Weak Bearish Divergence
Price makes a higher high but the RSI indicator makes an equal high. This is sometimes referred to as an exaggerated divergence as well.
Hidden Bearish Divergence
Price makes a higher low but the RSI indicator makes a lower low, but eventually goes back up. This is sometimes referred to as a continuous divergence as it is a continuation pattern.
How to trade RSI Divergences
Once you see a bullish RSI divergence, it means the current downtrend for the price may be ending and you can start buying the dip.
Once you see a bearish RSI divergence, it means the current uptrend for the price may be ending and you can start selling the rip.
Alternatively, if you are looking at longer term trends, you can use options to play the divergence, buying call options when you see a bullish divergence and buying put options when you see a bearish divergence. This can create one of the best risk/reward ratios in crypto when a long term trend is losing momentum as the crash or the rip can be intense.
Naturally, you should manage your risk to maximize the gain or minimize the loss.
What is the difference between RSI and MACD?
Another popular momentum indicator is the moving average convergence divergence (MACD). It shows the relationship between two moving averages of a token's price.
By default, the MACD is calculated by taking the 12-period exponential moving average (EMA) and subtracting the 26-period exponential moving average (EMA) from it, giving the the MACD line. The nine-day EMA of the MACD line is called the signal line, which is plotted on top of the MACD line. Traders may go long when the MACD crosses above its signal line, or short when the MACD crosses below the signal line.
Both the MACD and RSI measures momentum but using a different approach. The MACD measures the relationship between two EMAs, while the RSI measures price change momentum in relation to recent price highs and lows as well as identify opportunities when the token is either overbought or oversold. These two indicators are often used together to provide traders with more validation so they can enter a trade with more conviction.
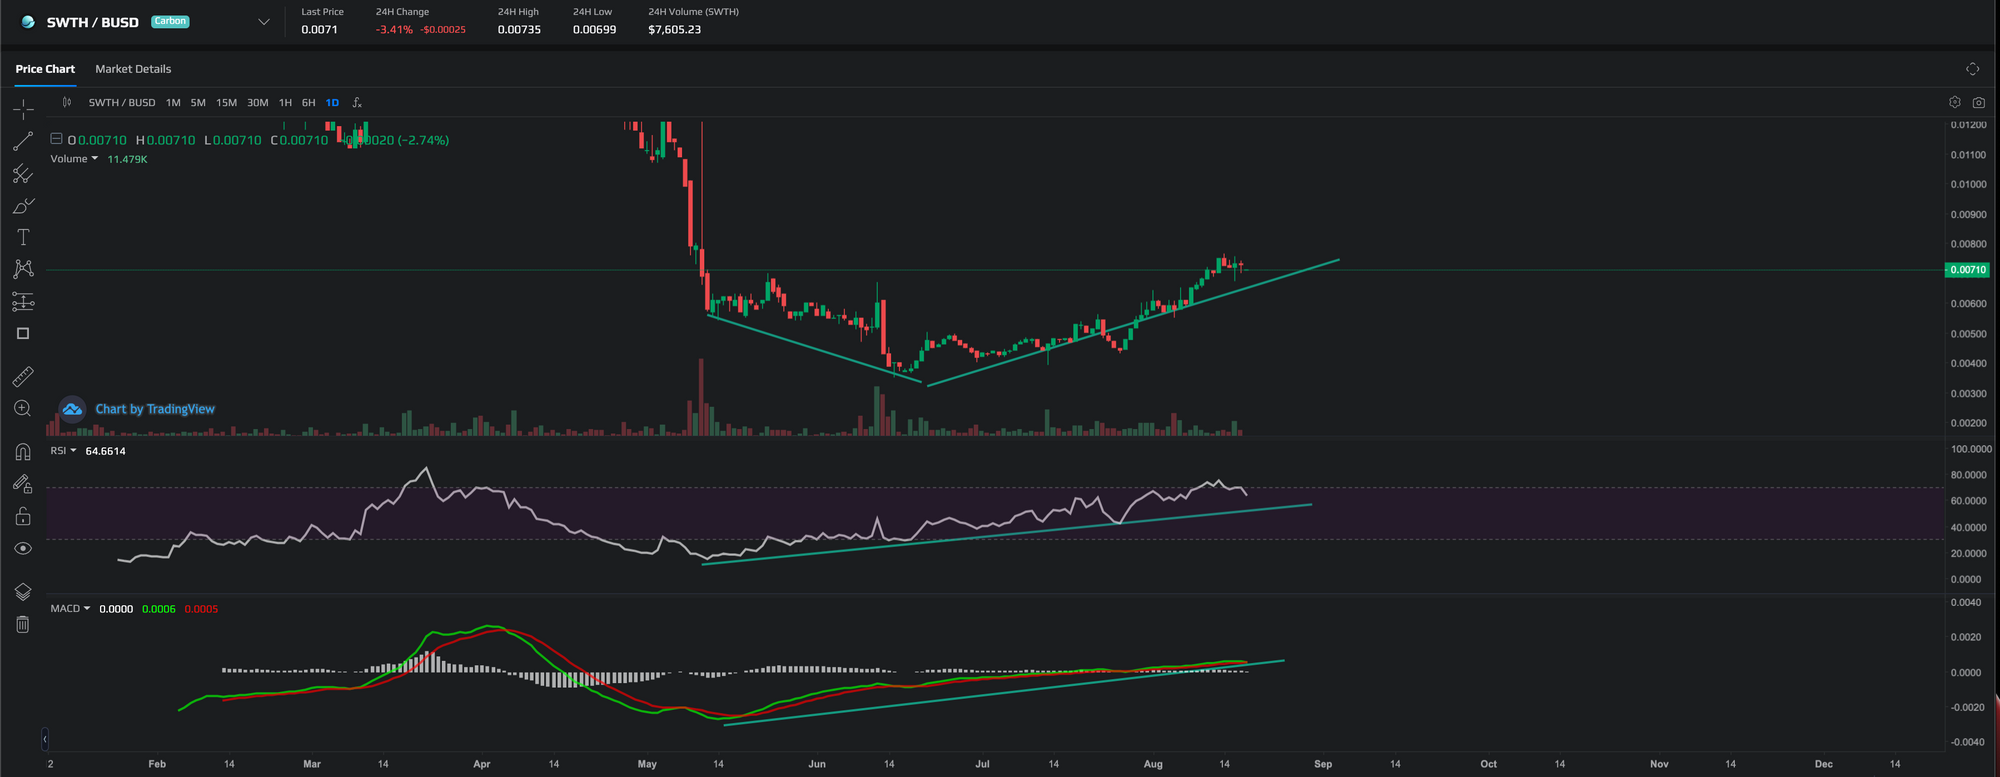
Using both the RSI and MACD indicator can create more validation of a bullish divergence for the $SWTH token.
Conclusion
The Relative Strength Index indicator is one of the classic technical indicator used by many traderes, making it an effective self-fulfilling indicator.
Learning how to use the RSI to determine oversold and overbought levels as well as divergences which can predict price divergences can be an invaluable skillset in going against the trend and buying the fear or selling the greed and securing your profits before the trend changes.